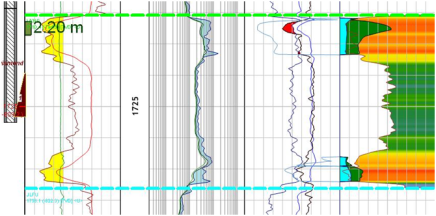
Customize the behavior of the special Composite Petrophysical log type, which displays on-the-fly calculated petrophysical curves (VShale, Phi, Water Saturated Phi, Sw, etc.).
The Petrophysical Definitions dialog box is built around the AccuLogs Embedded Petrophysical Engine, which is an easy to use tool that's tightly coupled to the AccuMap database. It requires minimum input from a geologist to produce an acceptable Phi estimation.
All basic industrial equations including calculation volume of shale from gamma ray, effective Phi estimation from density, sonic, or neutron logs, etc. and all of the required parameters (matrix, clay, fluid, compaction factor, etc.) are built in to the AccuLogs Embedded Petrophysical Engine.
The AccuLogs Embedded Petrophysical Engine uses the shaly rock model with either default or user-defined parameters. Volume of shale (VSH) is estimated from the gamma ray log using clean rock and shale values. Effective porosity Phi is calculated using a single porosity log (based on a porosity log search priority) with VSH used to correct engineering values for the presence of clays. Since in most cases at least one porosity log is recorded, this approach enables AccuLogs to get acceptable Phi coverage for more projects than other interpretation models that require two or more porosity logs to get Phi estimation.
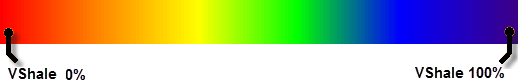
AccuLogs creates palletized color fill between the VShale curve and the right border of the petrophysical subtrack for the active petrophysical zone. A rainbow palette that consists of Red, Orange, Yellow, Green, Blue and finally Purple is used where Red = 0% VShale and Purple = 100% VShale as follows:
The AccuLogs default porosity log selection algorithm (Phi From = DENS, DT, NPHI) uses a hierarchy selection method where it uses (in order of preference) bulk density, sonic DT, or neutron porosity where it can’t find a density or sonic log. Other measured porosity curves such as sonic or density porosity can't be used in the AccuLogs Embedded Petrophysical Engine at this time due to the uncertainty about the matrix and the absence of a correction method for the presence of clays for these curve types.
Output Mnemonics
VSH* - volume of shale (%), PHI* - effective porosity (%), SW* - water saturation (%), PHISW* - water saturated porosity. The asterisk (*) above indicates an auto-generated, on-the-fly curve that updates based on user-defined petrophysical settings.
Further Usage
Choose petrophysical curves in Cutoff Zones. Single PHI cutoff can be used to create automatically generated measured tool artifacts associated with porous intervals, or to generate flags that correspond to Net Pay layers -example criteria: PHI > 12 and SW < 40.
To generate on-the-fly petrophysical curves
- Click Petrophysical Definitions(
 ) in the Options group of the Digital tab in the main ribbon.

The Global Petrophysical Definitions dialog box appears.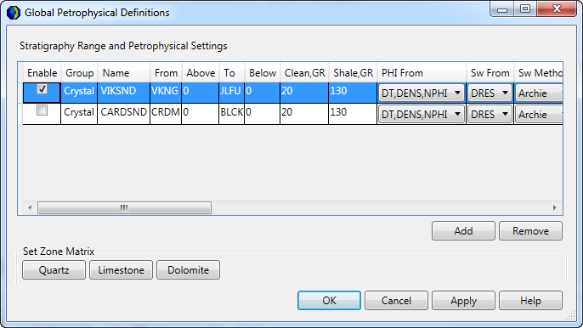
- Select whether to display an existing definition using the Enable check box, or click Add to create a new row. Being able to enable or clear a stratigraphy range means you don't have to delete a range to hide it.
- Select a zone of interest using the From and To cells, by triple-clicking in those cells to launch the Formation Lookup dialog box, from which you select the desired formations for the top and bottom of your zone.
- Using the PHI From drop-down list, select the curve types from which to determine porosity. This is a hierarchical selection method where if the first curve in the list is found in your zone of interest, it's used. Otherwise, the next curve is selected. If it doesn't exist either, the final curve is selected.
- Click the Set Zone Matrix button. By default, the Quartz setting is automatically applied.
- Type and select the desired terms and values directly in the grid. Note that the Set Zone Matrix buttons control the Density matrix (Dmx) and the Delta T matrix (DTmx) values, so if you type a value in either of these cells and then click one of the Set Zone Matrix buttons, the value you typed is overwritten.
- Click Apply to see the results of the above setting on the cross section, or click OK to return to the cross section window.
Before rendered petrophysical curves will appear in your cross section, you must select Wells > Log Layout and then click Add to display the Track Definition dialog box where you select Digital in the Format drop-down list and Composite Petrophysical in the Type drop-down list.