- With at least
one crossplot created in the main synthetic display, from the Edit
menu, select Crossplot properties
(
 ).
).
The Crossplot
Viewer and Crossplot Properties: Enclosures dialog box opens.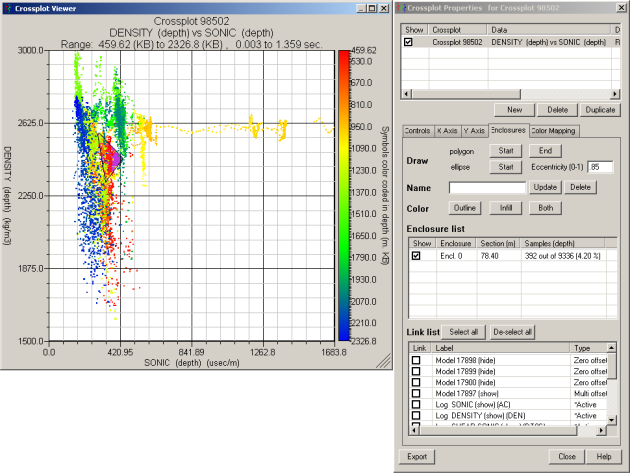
- Click the Enclosures tab.
- Do either of the following:
- To draw a polygon, click Start, and then click to define the anchor points for the polygon segments in the Crossplot Viewer. Click End to complete and automatically enclose the polygon.
- To draw an ellipse, type a decimal value from 0 to 0.99 in the eccentricity box. Click Start and then click to anchor one end of the ellipse. Move your mouse across from the start anchor point to the desired end point and then click to anchor that point.
As you draw polygons and ellipses, they're added to the Enclosure list below the drawing controls. Draw multiple annotations to encompass different features.
- In the Enclosure List, select the annotation with which to work (SHIFT+CLICK or
CTRL+CLICK for multiple selection).
In the Name box, type a descriptive name for the annotation(s) selected above. - Select from the following display properties:
- Outline to specify the annotation border color.
- Infill to specify the annotation fill color within the annotation border.
- Both to select one color for both the annotation border and fill.
- In the Link List pane, click the synthetic or log on which to display the data point highlighting.
To hide an annotation from the Crossplot Viewer, clear the check box in the Show column of the Enclosure list. You can also select the enclosure and then press Delete.