 or Y Axis
  .
.Display graphs for one or multiple items selected in Data Navigator. Control the manner in which data is graphed using both the Mode option and the Template options that appear above the graph. In Multiple mode, each item selected in Data Navigator is a distinct series on the graph.
For details on graph templates, see Related topics below.
To display a graph
1. From the Template drop-down list, select a pre-defined template (to use as is or to modify), or select a user template you previously created.
2. From the Graph menu, click either X Axis or Y Axis .
Depending on your selection above, either the X Axis (displayed below), Y Axis: Series, Y Axis: Labels, or the Y Axis: Grid dialog box appears.
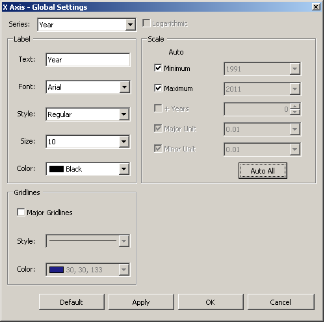
3. Select the desired display options, and then click OK.
4. From the Graph menu, click Title Box  .
.
The Title Box dialog box appears.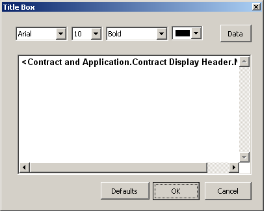
5. Click Data to display the Add Data dialog box and select data fields that can be automatically retrieved from the database and displayed in the graph title block.
Because the data fields selected above will appear in the Graph title block without labels, you may want to type some labels. For example above, the label Well Header and others are typed and then the item in angle brackets is the code used to retrieve the data item from the database.
The Title Box dialog box supports copy (CTRL+C), cut (CTRL+X), and paste (CTRL+V) functionality.
6. Select text formatting options, and then click OK.
To save the current graph configuration as a user template for future sessions, beside the Template drop-down list, click Edit.
The Graph Template Editor dialog box appears.
Either type a unique name, or select an existing name (of either a pre-defined or user-defined template), and then click OK.
EDIN won't overwrite pre-defined templates with user templates even if they share the same name.
7. Using Data Navigator, select the item(s) to graph. CTRL+CLICK or SHIFT+CLICK for multiple selection.
8. From the Mode drop-down list, select the method in which to graph the item(s) selected in Data Navigator based on the following:
Company Analysis - display hyperlinks to participant details in the Related Data pane that appears below Data Navigator.
9. Click Settings  .
.
The Graph Settings dialog box appears.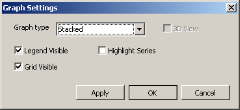
10. Select graph formatting options, and then click OK.
| About Data Navigator | Creating graph templates |
| Viewing underlying graph data | Outputting graphs |