Attributes Tab
The Attributes tab displays well information in a spreadsheet-style table. A default selection of attributes (named Auto Template) is displayed when one or more wells are selected in the Entity Viewer. See Attributes Tab Tasks for additional information.

Note: You can print this table or export it to a .csv file. Some of information displayed, such as Reservoir or Operator name, is not required to perform a well analysis, but can be helpful for filtering data.
The Attributes Properties tree view to the left of the table lists all of the available well attributes. When you select an item in the Attributes Properties list, it is displayed in the table as a column heading. (Deselecting an attribute removes it from the table.) Columns added to the table are appended to the far right in the order in which they are checked. However, you can drag columns to change this order.
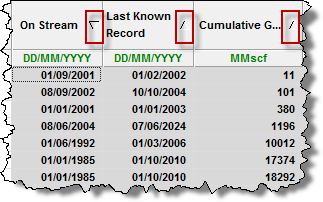
Clicking a column header sorts the table data by its attribute value, according to the same sorting rules that MS Excel uses (i.e., for alphanumeric attributes, numbers are sorted first from left-to-right (instead of top-to-bottom), then special characters, and finally letters. Apostrophes and hyphens are ignored except when there is text with a hyphen. In this case, the text with the hyphen is sorted last). And if you click a column header, and then press the Ctrl key, you can sort multiple columns at the same time. This will be indicated by a sorting arrow in each of the columns.
Well attribute data can be imported from a file / database, entered manually, or copied-and-pasted from another table cell. The table cell's color is used to identify the method by which data can be entered into the cell:
- Gray — read-only. These cells display data from another location in the program. Data in these cells cannot be modified.
- White (no drop-down list) — a value can be entered via the keyboard, or pasted from another cell.
- White (with drop-down list) — a value can be selected from the drop-down list, or a value from the drop-down list can be pasted into these cells.
Custom Attributes
You can add custom well attributes in the Attributes Properties pane. See Custom Attribute Tasks for more information.
Special Functions
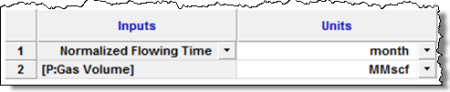
There are four special functions: MinCol, MaxCol, Avg, and ValueAt. These functions require production datasets (referred to as columns) as inputs, and normalized time must also be specified. The units of normalized time can be chosen in the Inputs / Units pane in the Equation Editor. The values "start" and "end" can also be entered as normalized time values. "Start" refers to the beginning of production history, and "end" references the last date of production.
Note: Normalized time must be specified as an integer.
1. MinCol – This function returns the smallest value of the specified column, over a specified period of normalized time.
Equation Format: MinCol(column, start time, end time)
For example: MinCol([P:Gas Volume], end-6, end)
This returns the minimum gas volume during the last six months of production.
2. MaxCol – This function returns the greatest value of the specified column, over a specified period of normalized time.
Equation Format: MaxCol(column, start time, end time)
For example: MaxCol([P:Gas Volume], start, end)
This returns the maximum gas volume during the entire production history of the well.
3. Avg – This function returns the weighted average of the specified column, over a specified period of normalized time.
Equation Format: Avg(column, start time, end time)
For example: Avg([P:Gas Volume], 3, 12)
This returns the average gas volume between the 3rd and 12th months of production.
4. ValueAt – This function returns a scalar value from the specified column, at a specified normalized time.
Equation Format: ValueAt(column, time).
For example: ValueAt([P:Gas Volume], end)
This returns the gas volume at the end of production.
Note: You can specify the desired time in normalized flowing time as well. Enter your formula, click the Update Grid button, and then select Normalized Flowing Time from the drop-down menu in the Inputs / Units pane.
Custom Categories
You can add custom categories in the Attributes Properties pane. See Custom Category Tasks for more information.
Custom Attribute Templates
By displaying or hiding attribute properties and reordering the category headers, you can organize the Attributes table to display data in the order that is most useful to you. You can then save this configuration as a template for later re-use. See Custom Attribute Template Tasks for additional information.
Note: To return to Harmony's default template, click the Auto Template option.

Attributes Editor Support for Multilayer Wells and Layers
Multilayer wells contain the same attributes as a standard single-layer well.
Layers contain the same attributes as a well. Of those attributes, some are inherited from the well, while others are unique to the layer. See the Attribute Rules table (PDF - opens in a new window) for more details.
Attributes will be displayed if wells are (or a well is), selected. Attributes will be displayed if layers are (or a layer is), selected. However, attributes will not be displayed, if the selection contains a mixture of layers and wells.
Note: The Number of Fractures attribute, nf, is shown at the well level, and is calculated by summing the Number of Fractures from all of the well’s layers.