GIS Tab
GIS Map View
The geographic information system (GIS) tab displays entities on a map based on one of the standard coordinate systems.

Note: Entities are displayed on the GIS map only if their attributes include geographical coordinates. If a well that you expect to see on the GIS map isn't there, highlight it in the Entity Viewer, click the Attributes tab, open the Location heading, and verify that the Latitude / Longitude attributes are valid. See Using the Map for additional information.
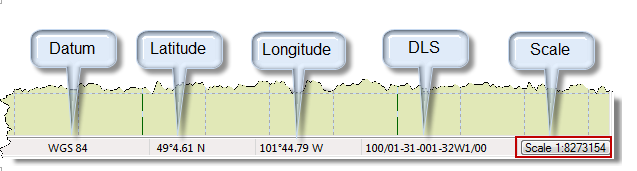
As you mouse over the GIS map, the status bar displays the latitude, longitude, and dominion land survey (DLS) at the current location.
GIS Toolbars
There are four toolbars on the GIS tab:
Map Mode
This toolbar handles map-related functionality:

From left-to-right, the icons include map selection, zooming , panning, distance measurement, go to, zoom-to-previous extents, zoom-to-next extents, well information, bubble maps, annotation display, view reset, rulers, scale, printing, and datum selection. A few of these features are described in more detail below.
GoTo
The Go To icon (![]() ) on the toolbar provides a variety of options for zooming into a map area, such as selecting a Latitude/Longitude Location.
) on the toolbar provides a variety of options for zooming into a map area, such as selecting a Latitude/Longitude Location.
With this selected, you can enter your coordinates (in one of the available entry formats). The map will automatically zoom in to the location specified.
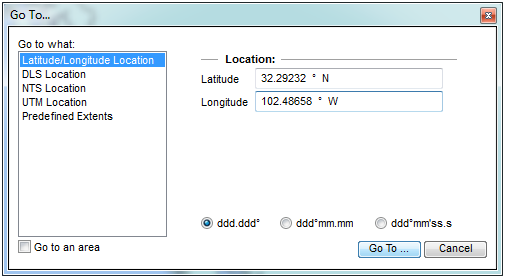
You can also zoom to an area by checking the Go to an area checkbox in the lower left corner. The map will then zoom to the area bounded by the north east and south west input coordinates.
Zoom to previous and next extents
The Zoom-to-previous extents ( ) and zoom-to-next extents (
 ) icons enable toggling between zoom settings.
View Reset
The view reset ( ) icon zooms back to facility bounds (i.e., the map zooms out to display all facilities on the map, or if there are no facilities, the map zooms out to the default zoom setting).
Design Mode
Use this toolbar to draw facilities on the map.

From left-to-right, the icons enable you to move a facility, create an oil facility, gas facility, water facility, location facility, other facility type, coal bed methane (CBM) facility, and a facility name generator.
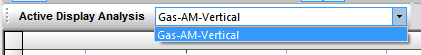
Active Analysis
From this toolbar you can select an analysis from the drop-down list, so that you can display annotation data.
Print Preview
From this toolbar you can print regions of the map.

From left-to-right, the icons enable you to select a printer, select paper format, select letter or landscape orientation, reset the print configuration view, select the print configuration area for viewing, and add or remove print configurations.
GIS Configuration Pane
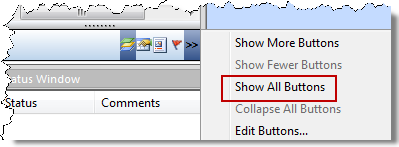
The GIS Configuration pane has the following buttons:
If you don't see the buttons mentioned above, you may need to click the angle brackets (>>) and select Show All Buttons.
Layers
Layers are graphical strata that you can display over the GIS map. Layers include gridlines, geopolitical borders, and well icons. To display a layer, select the layer's checkbox; to hide a layer, deselect its name.

To display layer options, click the Layer-specific Options (![]() ) icon. Available options will depend on the type of layer you selected. Various types of layers are described below. See Layer Tasks for additional information.
) icon. Available options will depend on the type of layer you selected. Various types of layers are described below. See Layer Tasks for additional information.
Properties
Properties are used to fine-tune the GIS map. Property descriptions are displayed at the bottom of the pane as they are selected.

Legend
The Legend lists all of the possible symbols that may be found on the GIS map.

Note: Meter stations are displayed on the GIS map only if they are included in an imported .dp2 or a 298 file.
Flag Properties
Flag Properties enable you to overlay flags on top of entities on the GIS map.
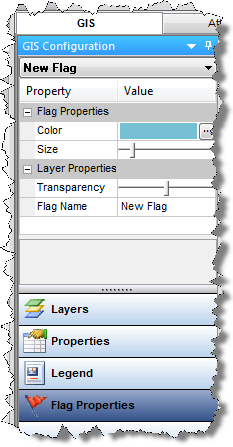
Flags are similar in appearance to bubble maps, but they do not reflect well attributes. Instead, they are simple markers that can be used to designate individual or multiple entities.

Flags are represented as layers on the GIS map, and can be selectively enabled or disabled like other layers. See Flag Tasks for additional information.