Customizing Text
This topic describes the options for adding and modifying text.
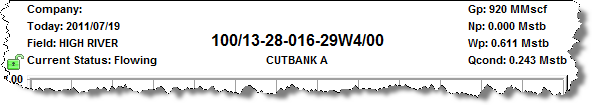
Title & Headers
By default, plots have a main title and left and right headers. These titles and headers display well attributes as text, which you can edit.
1. Select one or more entities in the Entity Viewer; then click the Diagnostics tab.
2. Right-click either the plot, or the title, or a header, and then select Main Title.../Left Header.../Right Header...
The Titles dialog box opens.

3. Make your modifications from the following options:
- Click the down arrow; then select an attribute from the drop-down menu.
- You can manually enter heading content clicking the User Text option. When this option is selected, you can use the formatting controls, including setting a line in the title to be blank. You can also change the text style.
- There may be some cases where the information in the header is useful while doing an analysis, but not desired on printouts. The visibility state controls can be used to control if the information is shown or hidden.
4. Click OK to accept your changes.
On-screen Text
You can customize the appearance of on-screen text by clicking the following icons:
-
 — changes
the font
— changes
the font -
 — changes
the text size
— changes
the text size -
 — applies
bold
— applies
bold -
 — applies
italics
— applies
italics -
 — applies
underline
— applies
underline -
 — changes
text alignment (justified, centered, or right-aligned)
— changes
text alignment (justified, centered, or right-aligned) -
 — applies
superscript
— applies
superscript -
 — applies
subscript
— applies
subscript -
 — adds / removes
bullet points
— adds / removes
bullet points -
 — changes
text color
— changes
text color -
 — inserts
an uppercase Greek letter
— inserts
an uppercase Greek letter -
 — inserts
a lowercase Greek letter
— inserts
a lowercase Greek letter
Annotations
Annotations are short notes appended to a plot. You can add annotations to plots in the Analysis tab and the comparison plot in the Results tab.
To display an annotation on the plot:
1. Display a plot in the Analysis tab or the Comparison Plot in the Results tab.
2. Click
the Create Annotation icon (![]() ).
).
The Create Annotation dialog box opens.
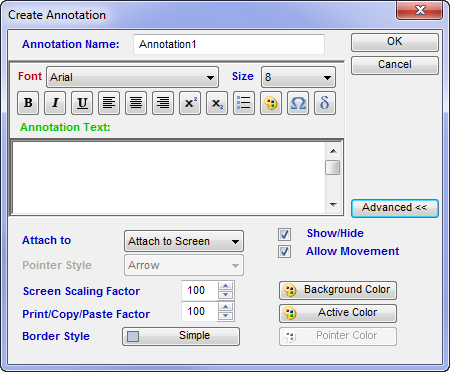
3. Make your modifications from the following options:
- Font — see On-screen Text.
- Annotation Text — enter the text for your annotation here.
- Advanced — shows / hides the advanced options.
- Attach to — defines the placement of the annotation. You can attach it to the screen, the plot, or data.
- Pointer Style — allows you to set an arrow, or a dot at the location the annotation is attached to. (Only available if you attach to data.) You cannot change the pointer once it is set.
- Show/Hide — shows / hides the annotation on the plot.
- Allow Movement — determines whether or not the annotation can be dragged on the plot.
- Screen Scaling Factor — allows you to increase / decrease the size of the annotation by a percentage.
- Print / Copy / Paste Factor — sets the size of the plot if it is copied-and- pasted into a graphics program. Selecting 100% pastes the same size as shown on the screen.
- Border Style — determines the style of the border around the annotation.
- Background / Active / Pointer Color — allows you to select the color of the plot's background, background when selected, and pointer.
4. Click OK to accept your changes.