Summary Tables (Gas AOF / TPC)
There are three summary tables to assist in analyzing scenarios:
1. TPC Summary Table
2. AOF Summary Table
3. Operating Point Summary Table
TPC Summary Table
To display the tubing performance curve (TPC) summary table:
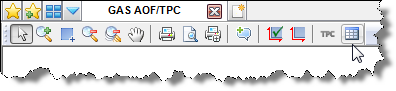
Click the TPC
Summary Table icon (![]() ) in the Analysis
Manager.
) in the Analysis
Manager.
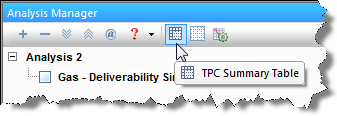
This table provides an overview of all the TPCs within the Gas AOF / TPC worksheet, including their critical rates and velocities at the wellhead (WH) and at the end of tubing (EOT).
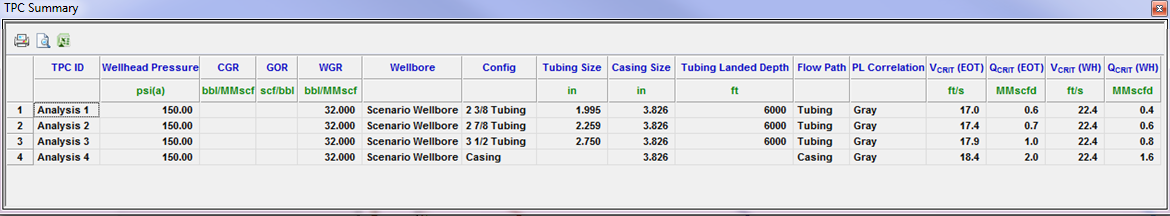
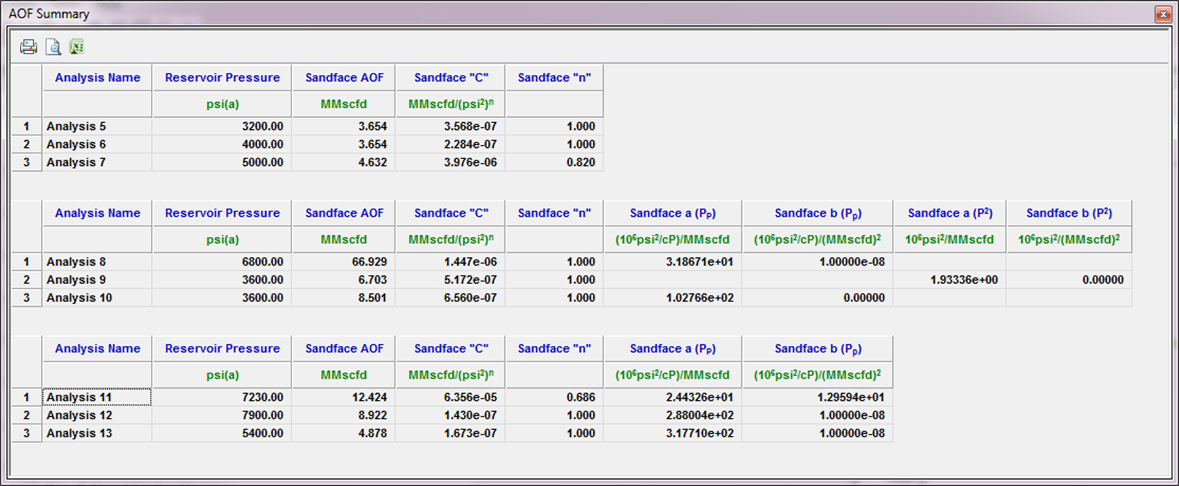
AOF Summary Table
To display the AOF summary table:
Click the AOF
Summary Table icon (![]() ) in theAnalysis
Manager.
) in theAnalysis
Manager.
This table displays the results of all the deliverability analyses within the Gas AOF / TPC worksheet. Reservoir parameters entered within a Forchheimer analysis are also displayed in the table.
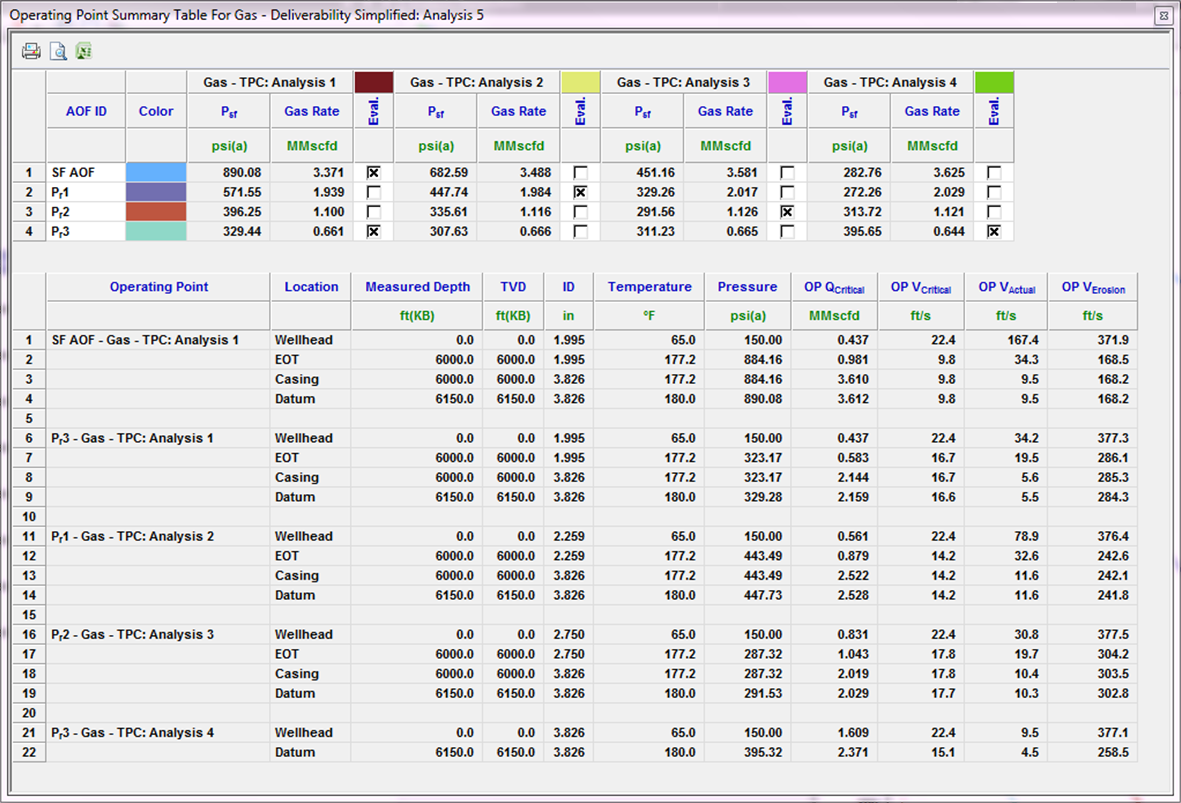
Operating Points Summary Table
To display the Operating Points summary table:
Click the Operating
Points Summary icon (![]() ) on the
Worksheet Analysis toolbar. See Worksheets for additional information.
) on the
Worksheet Analysis toolbar. See Worksheets for additional information.
This table provides the sandface pressure and gas rate coordinates of each operating point on the plot, so that you can evaluate multiple operating points for an in-depth wellbore analysis.