Previewing Well Data
There is a live connection between the Entity Viewer and the tab views. Clicking one or more entities in the Entity Viewer displays the data related to those entities in the main pane. Importantly, this link works both ways: clicking a well in the main pane highlights the well in the Entity Viewer. The following examples show how you can use this live link to preview wells, or groups of wells.
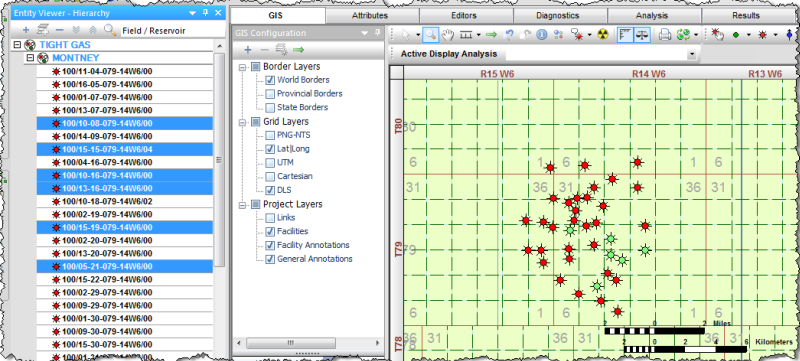
Highlighting entities in the Entity Viewer highlights those entities on the GIS map.
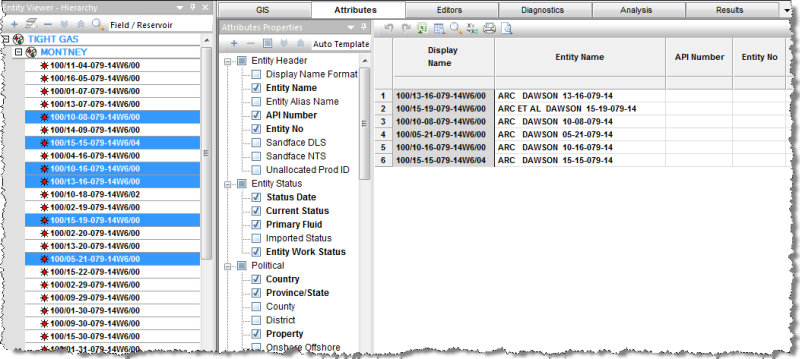
Highlighting entities in the Entity Viewer displays those entities and their associated data in the Attributes tab.
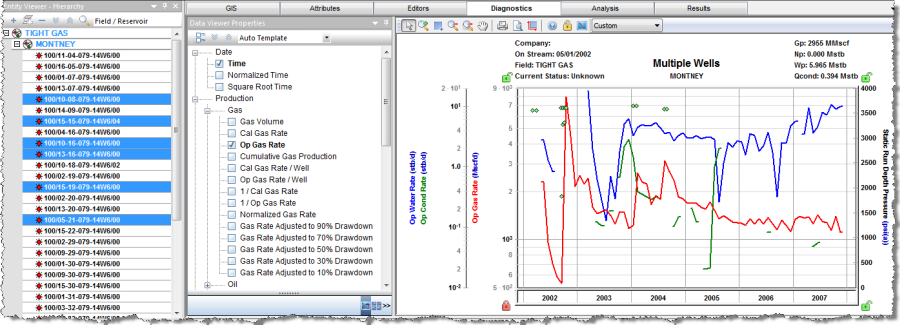
Highlighting entities in the Entity Viewer displays a graph of their associated data in the Diagnostics tab.
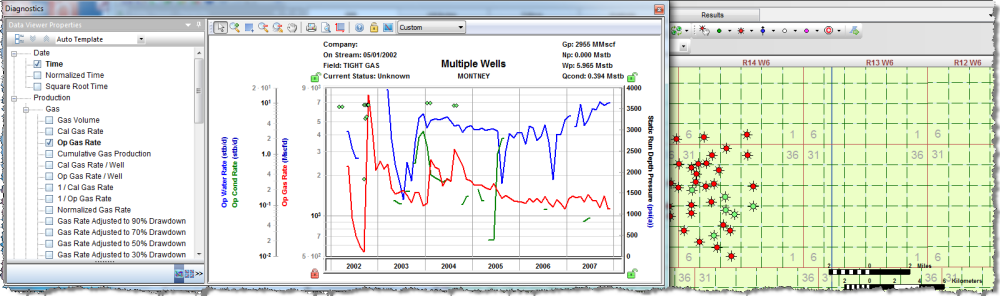
Floating the Diagnostics tab over the GIS map; then clicking wells on the GIS map, previews their diagnostics data.