Creating Custom Reports
Custom reports are used to create templates for your specific viewing / printing needs.
To create a custom report:
1. Navigate to the worksheet you want to print.
2. Click
the Print Preview icon (![]() )
and select the type of report you want.
)
and select the type of report you want.
The Plot Preview window will open.
3. Click
the Design icon (![]() )
and then click the Design tab.
)
and then click the Design tab.
4. To customize your report, click these Tools icons:
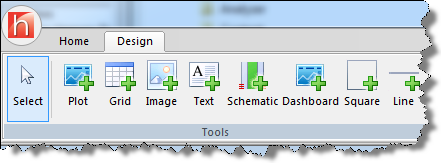
- Plot — Add a plot by clicking- and-dragging to draw a box where your plot will be added. You can change which plot is added by double-clicking the plot, and selecting from a list of available options in the Plot Selection window. Click OK when done.
- Grid — Add a grid by clicking-and-dragging to draw a box where your grid (table) will be added. You can change which grid is added by double-clicking the grid, and selecting from a list of available options in the Grid Selection window. Click OK when done.
- Image — Add an image by clicking-and-dragging to draw a box where your image will be added. Browse to your file and click Open.
(Supported file types include the following: jpeg, jpg, jfif, bmp, tif, tiff, png, ico, emf, and wmf.) - Text — Add text by clicking-and-dragging to draw a box where your text will be added. Type your text and use the Fonts palette to format your text properties. Click outside the box when done.
- Schematic — Add a schematic by clicking-and-dragging to draw a box where your schematic will be added. You can change which schematic is added by double-clicking the schematic, and selecting from a list of available options in the Schematic Selection window. Click OK when done.
- Dashboard — Add a dashboard
 by clicking-and-dragging to draw a box where your dashboard will be added. You can change which dashboard is added by double-clicking the dashboard, and selecting from a list of available options in the Dashboard Selection window. Click OK when done.
 - Square — Add a square by clicking-and-dragging to draw a box of the appropriate dimensions. You can adjust the height and width of this object by dragging the edges of the square.
- Line — Add a line by clicking-and-dragging where you line begins and ends.
If you'd like to adjust the display to focus on the vertical axis, click the Fit to Height icon (![]() ).
).
If you'd like to adjust the display to focus on the horizontal axis, click Fit to Width icon (![]() ).
).
5. Click the Home tab and save your report.
6. Click the Close icon to return to the main Harmony window.
Note: The newly created custom report can now be selected after clicking the Print, Print Preview, and Add to Print Queue icons. If you select your custom report after clicking the Add to Print Queue icon, your custom report will be viewable from the Reporting tab.