GIS
The geographic information system (GIS) tab displays entities on a map
based on one of the standard
coordinate systems.
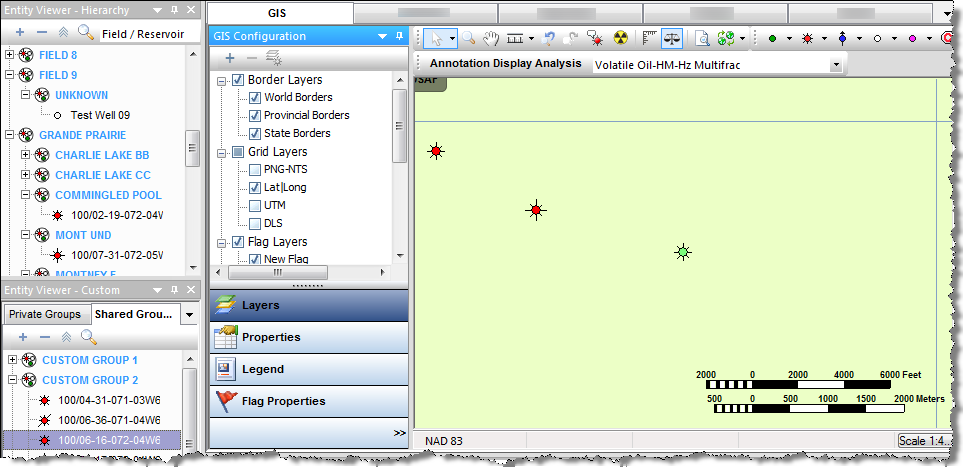
Entities
are displayed on the GIS map only if their attributes include geographical coordinates.
If you expect to see well on the GIS map and it is not there,
highlight it in the Entity Viewer - Hierarchy or Custom, click the Attributes tab, double-click Location in the tree structure, and verify that the latitude / longitude attributes are valid. For more information, see GIS map.
Toolbars
There are four toolbars on the GIS tab:
1. GIS Configuration pane
2. GIS toolbar
3. GIS design mode tools
4. Active analysis
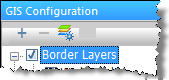
GIS Configuration pane
This toolbar handles layer functionality.
- Add Layer — adds various types of layers (that is, a shapefile layer, image layer, general annotation, bubble map layer, or a flag layer).
- Remove Layer — deletes a layer. Note that you cannot delete Project Layers.
- Layer-specific options — select from these options: group display layers by type, shapefile info, DBF info, customize shapefile drawing, highlight shape(s), and show / hide labels.
GIS toolbar
This toolbar handles map-related functionality. For a description of common icons, see toolbars.

-
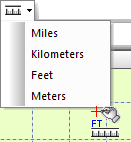 Measure — select your scale from the drop-down list. Click the first location on the map and then drag the mouse to the second location. The distance is displayed between the two points, and updates automatically when the distance changes.
-
 Go back to Previous Extents — reverts your display to the previous zoom setting.
-
 Go to Next Extents — updates your display to the next zoom setting.
- The current extents are saved on a per-user, per-project basis. When you open the project again, the last-used extents (zoom level) is applied.
-
 Annotation Display Options — opens the Facility Annotation Editor dialog box where you can customize your annotation display. This icon is grayed-out when the annotation layer is not supported because there are too many wells on-screen.
-
 Reset GIS — zooms out to display all the wells on the map, or if there are no wells, the map zooms out to display the entire world).
-
 Rulers — displays a ruler along the top and left-side of the map. This can be toggled on or off.
-
 Scale — displays a map scale in the lower right corner of the map. This can be toggled on or off.
-
 NAD Conversion — from the drop-down list, select NAD 83 (North American Datum, modified in 1983), NAD 27 (North American Datum, created in 1927), or WGS 84 (World Geodetic System, modified in 1984).
GIS design mode tools
Use this toolbar to draw wells on the map.

From left-to-right, the icons enable you to add an oil well (green), gas well (red), water well (blue), location (white), other well (pink), and coalbed methane (CBM) well to the GIS map.
|
Note:
|
Icons on this toolbar are only active if you are zoomed-in close enough. |
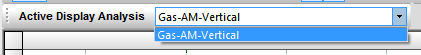
Active analysis
From this toolbar, you can select an analysis name from the drop-down list. The data from this analysis is used in Results annotations.
GIS Configuration pane
The GIS Configuration pane has the following buttons:
- Layers
- Properties — are used to fine-tune the GIS map. Property descriptions are displayed at the bottom of the pane as they are selected.
-
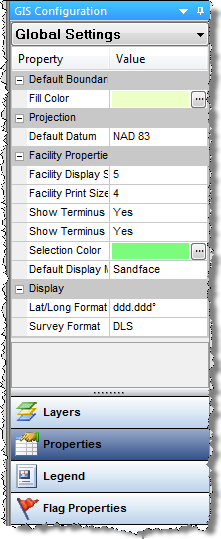
- Legend — lists all of the symbols that may be found
on the GIS map.
-
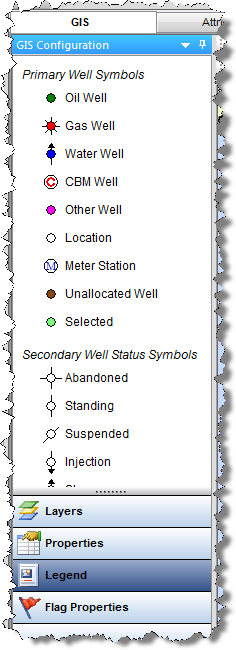
Note: Meter
stations are displayed on the GIS map only if they are included in an imported
.dp2 or a 298 file.
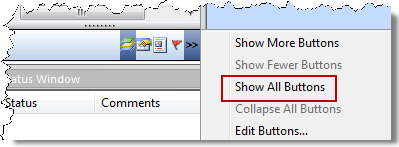
If you do not see these buttons, click the angle brackets (>>) and select Show All Buttons.
Context menus
Right-clicking within the GIS Configuration pane lists various options, which depend on the type of layer you select (for example, border layers, grid layers, and so on):
- Select All Layers — selects all of the layers for that layer type (for example, border layers).
- Deselect All Layers — deselects all of the layers for that layer type.
- Group Display Layers By Type — selecting this option groups layers by type; deselecting displays a flat list.
- Add Shapefile Layer — browse to your shapefile (.shp) file.
- Shapefile Info — opens the Shapefile Info dialog box where detailed information is provided (such as, the number and type of shape, label selection) along with a preview image.
- DBF Info — opens the DBF Info dialog box where attribute information is displayed. (The information in the DBF file is used when shapes are converted to facilities.)
- Customize Shapefile Drawing — opens the Customize Shapefile Drawing dialog box where you can change the line color, line thickness, fill color, and other visual attributes of the shape. You can also reset the settings to the default values.
- Highlight Shapes — highlights the selected shape.
- Show Labels — displays the label title for the shape.
- Rename Shapefile Layer — opens the Rename Layer dialog box where you can type in a new name for your shapefile.
- Remove Shapefile Layer — deletes the shapefile layer. Note that you are not prompted to confirm your decision.
- Add Flag Layer — adds a flag layer to the map.
- Flag Properties — opens the flag properties for that flag.
- Remove Flag Layer — deletes the flag layer.
- Options — opens the Bubble Map Editor dialog box where you can customize your bubble-map display.
- Auto Range — calculates a range based on the data for the entities used in the pie chart bubble map.
- Legend — select the item you want to display in the legend from the submenu (for example, color, size, section, and so on).
- Rename — opens the Rename Layer dialog box where you can type in a new name for your bubble-map layer.
- Remove Bubble Map Layer — deletes the bubble-map layer. Note that you are not prompted to confirm your decision.
- Add General Annotation — opens the General Annotation Editor dialog box where you can type your annotation and customize its display. You can also anchor the annotation to a specific location.
IHS Harmony Enterprise™ 2018.1 | Last revised: March 20, 2018
Copyright © 2018 IHS Markit Ltd. All rights reserved.