You can add a multi-segment decline analysis to a decline worksheet (see analyzing an entity).
| Note: | This analysis works with your Harmony Forecast™ license. |
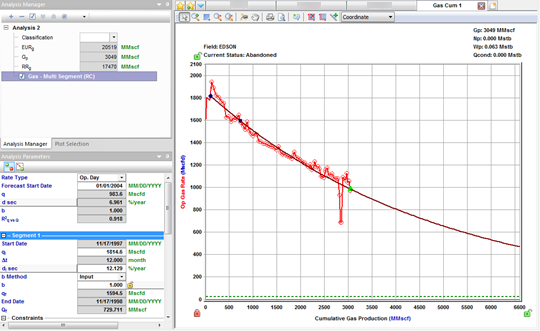
When you add a multi-segment decline analysis to your worksheet, Harmony Enterprise initializes your analysis with a two-segment decline analysis, based on the initialization settings specified in the Options dialog box. You can add as many decline segments as you want to the first two segments, by clicking the Add Segment icon on the Analysis Parameters toolbar.
| Note: | Segments can only be added or removed after the first two (fixed) segments, and these segments follow the Arps' decline analysis. |
Multi-segment decline analyses have these properties:
- The first segment's decline starts at either the initial production date, or the date corresponding to the historical peak rate, based on your multi-segment decline options.
- The nominal decline rate (a) at the end of the first segment is equivalent to the nominal decline rate at the beginning of the second segment, in order to enforce a smooth transition between these two segments.
- The qi (initial production rate) of the second segment is set to the qf (final production rate) of the first segment.
- After you add a secondary segment (to these two initial segments), qi of the secondary segment is set to the qf of the preceding segment. Also, the nominal decline rate (a) at the beginning of the new segment and end of the preceding segment are set to be equal. For information on how a new segment is initialized, see decline initialization.
- For a new segment, you can specify your calc method, but the default method is qf / Qf. This method enables you to enter the initial rate (qi), initial effective decline rate (di), b value, and time; the calc method calculates the final rate (qf), and cumulative production (Qf).
- The b value defaults to the value from the preceding segment, and a duration of 60 months is initially applied.
Analysis Parameters pane
For a description of general parameters and options, see the decline: Analysis Parameters pane and decline: Analysis Parameters toolbar.
The differences between multi-segment and Arps' decline analyses are described below.

- For the initial (segment #1 and segment #2) decline segments, a calc method cannot be specified.
- You can choose for your b value to be manually input, or selected from a custom attribute, under the b Method drop-down list.
- You can modify the constraints for your first decline segment under segment 1. For additional information, see constraints.
- For the second segment, you cannot specify a calc method, but you can define a limiting decline rate (both exponential and hyperbolic) by toggling dlim exp / dlim hyp and entering a value.
Line manipulation
Most of the line manipulation from the decline analysis is the same. However, some of the functionality is slightly different for the initial and secondary segments of your decline.
1. Since the initial decline rate at the beginning of the second segment is forced to be equivalent to the decline rate at the end of the first segment, you cannot use the Ctrl key to change the curvature, and hence the b value of the second segment. However, you can still use this functionality on any other secondary segment.
2. For the purpose of maintaining a smooth transition between the two segments, you cannot "click, grab-and-drag" the second segment and tilt your decline.
Line manipulations are initiated by clicking (sometimes while pressing the Ctrl or Shift keys) the line itself, or one of the manipulation points for a given segment (start date, forecast start date, or end date). You can cancel your line manipulation by pressing the Esc key.
| Tip: | Any time you see "click", this means to left-click your mouse. Right-click actions are specifically mentioned. |
- Forecast Start Date, (FSD) (indicated by a green triangle on the decline line)
- Click, grab-and-drag — moves the FSD along the decline curve, but does not change the decline itself. The FSD and consequently the production rate (q), and the effective decline rate (dsec) are updated.
- If you position the FSD anywhere beyond the historical production data on a rate-time plot, it simulates a shut-in. Note that you cannot locate the FSD beyond the historical production data on a rate-cumulative plot.
- If you move the FSD to the first segment and then grab-and-drag, the decline line shifts vertically when you move your mouse up and down. The shape of the decline (b and d) is preserved, and q and qi get updated. - Shift key — the effect of the Shift key on FSD depends on where the FSD is located:
- If the FSD is located in the second segment (the default position), pressing the Shift key results in behavior similar to "click, grab-and-drag".
- If you move the FSD to the first segment of the decline, pressing the Shift key enables you to move the FSD along the decline curve. - Ctrl key — if the FSD is located in the second segment, pressing the Ctrl key results in behavior similar to "click, grab-and-drag". However, if FSD is on the first segment, pressing the Ctrl key enables you to translate the decline in time.
- Click, grab-and-drag — moves the FSD along the decline curve, but does not change the decline itself. The FSD and consequently the production rate (q), and the effective decline rate (dsec) are updated.
- Start Date (indicated by a blue circle)
- For any segment excluding the second segment, all three line functions (1. click, grab-and drag, 2. Shift key, 3. Ctrl key) behave the same as the default "click, grab-and-drag" behavior for the Start Date.
- For the Start Date of the second segment, all three line functions behave the same and enable you to reposition the point along the decline curve. The Start Date adjusts the transition point by setting the time constraint to the current position and clearing the other constraints.
- End Date (indicated by a blue square)
- For the first segment and second segment, all three line functions behave the same. They extend your forecast forward in time and decrease your abandonment rate (qf). The final cumulative production (Qf) increases, but none of the decline parameters change.
- For any additional segments, line functions performed on the end date behave the same as the default end-date line functions.
- Any point on the forecast decline curve (activated when the decline segment turns orange)
- All line functions remain the same as the default "any point" line functions, when you adjust the first segment or any added segments.
- You cannot manipulate the second segment.
| Note: | To customize your decline line, see decline-line customization. |