The stretched exponential decline method is a variation of the traditional Arps method, but is better suited for unconventional reservoirs due to its bounded nature. For more information, see stretched exponential decline theory.
| Note: | This analysis works with your Harmony Forecast™ license. |
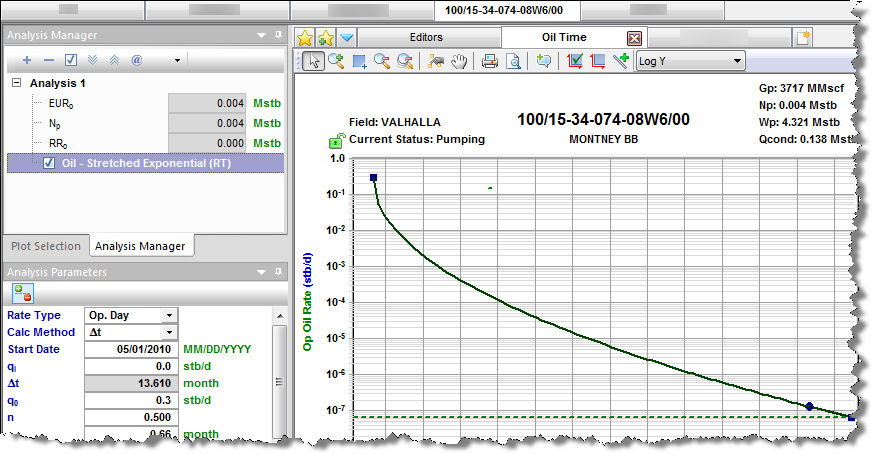
Analysis Parameters pane
After you add your decline analysis (see analyzing an entity), the selected analysis (highlighted in purple) has its detailed parameters displayed in the Analysis Parameters pane located below the Analysis Manager pane (the default setting).

In this pane, you can specify / view the following settings and parameters:
(The parameters that are displayed depend on if the analysis was created on a rate-time (RT) or rate-cumulative (RC) production plot.)
- Rate Type — select calendar rate (Cal. Day) or operator rate (Op. Day) from the drop-down list. For more information, see decline analysis: rate type.
- Calc Method — select the method by which the decline analysis is calculated (for example, ∆t or qf) from the drop-down list.
- Start Date — the end of production data and the date of the forecast start, represented by the middle point of the analysis line.
- qi — the initial gas / oil production rate for the forecast.
- Qi — the cumulative production at the start of the forecast.
- ∆t — the duration of the decline segment.
- qo — a stretched exponential qo term. (The initial rate at the start of production. Not to be confused with qi, which is the initial rate at the start of the forecast.)
- n — a stretched exponential n term; it must be between 0 and 1.
- ז — a stretched exponential t term; it must be positive.
- qf — the gas / oil production rate at the end of the forecast.
- End Date — the date the forecast ends.
- ∆Q — the cumulative production that occurs during the forecast period.
- Qf — the cumulative production at the end of the forecast — expected ultimate recovery (EUR).
- EUR0 Infinite — the EUR if the abandonment rate = 0.
- R2 — an indication of the precision of the history match. It is reported as R2log q vs t on a rate-time (RT) plot, and R2q vs Q on a rate-cumulative (RC) production plot.
Analysis Parameters toolbar
The Analysis Parameters toolbar has the following icon:
 Show / Hide Results Line — shows (default setting) or hides the dashed-green line on the plot that represents the abandonment for the stretched decline analysis..
Line manipulation
Line manipulations are initiated by clicking (sometimes while pressing the Ctrl or Shift keys) the line itself, or one of the manipulation points for a given segment (start date, forecast start date, or end date). You can cancel your line manipulation by pressing the Esc key. Specific line manipulations are described below:
| Tip: | Any time you see "click", this means to left-click your mouse. Right-click actions are specifically mentioned. |
- Start Date (indicated by a blue circle)
- Click, grab-and-drag — moves the decline line vertically to change the qi of the segment. However, it does not change the start date or Forecast Start Date (FSD). The shape of the decline (b and d) line is preserved.
- Both qi and q for the segment being manipulated get modified, and all segments following this segment are shifted in time / cumulative production, accordingly. - Shift key — pressing the Shift key while dragging extends your forecast back into the historical production. The start date, qi, and di change, but the b value is not impacted.
- This Shift-key functionality does not apply to a secondary segment. - Ctrl key — pressing the Ctrl key while dragging translates the curve along the x-axis. The start date, FSD, and forecast end date advance in time for the first segment.
- This Ctrl-key functionality does not apply to a secondary segment.
- Click, grab-and-drag — moves the decline line vertically to change the qi of the segment. However, it does not change the start date or Forecast Start Date (FSD). The shape of the decline (b and d) line is preserved.
- End Date (indicated by a blue square)
- Click, grab-and-drag — enables you to move the end date in time, anchoring to the start date and maintaining the qf. The b value is maintained, but di is updated. If the FSD is contained within the segment, then q and d update as well.
- Shift key — pressing the Shift key while dragging extends your forecast forward in time, and decreases your final rate (qf). Your final Qf increases, but none of the decline parameters change.
- Ctrl key — visually similar to the grab-and-drag functionality for the end date, but the b value can change with the Ctrl-key functionality.
- Any point on the forecast decline curve (activated when the decline segment turns orange)
- Click, grab-and-drag — If the segment contains the FSD, that segment is anchored to the FSD and rotates around while the b value and qf are maintained.
- On a segment that does not contain FSD, the decline is anchored to the start date of the segment.
- If you accidentally place the FSD at the end date of a segment, the decline is anchored to the end date of the segment. - Ctrl key — the curvature of the line (the b value) changes.
- Click, grab-and-drag — If the segment contains the FSD, that segment is anchored to the FSD and rotates around while the b value and qf are maintained.
To customize your line, right-click it. For more information, see decline-line customization.