Common causes for data inconsistencies are as follows:
- Recompletion, reperf, refrac
- Fracture cleanup
- Wellbore cleanup
- Liquid loading
- Slugging
- Tubing change-out
- Changing flowpath
- Under-reported work-overs
- Incorrect pressure source and flow path
- Pressure or rate averaging
- Out of sync pressure and rate time-tracks
- Missing flowing pressures or rates
- Incorrect initial pressure
- Misreported water production
- Significant increase in water gas ratio (WGR)
Use the flowchart below to evaluate the quality of your data:
|
Start pre-analysis diagnostics here
|
|||
|
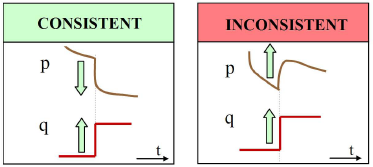
Do the instantaneous changes in pressure and rate correlate?
|

|
See the step change correlation on the rate & pressure vs. time plot. |
|
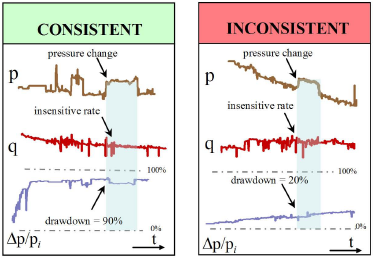
Is the well operating under high drawdown?
|
|
See the drawdown plot. |
|
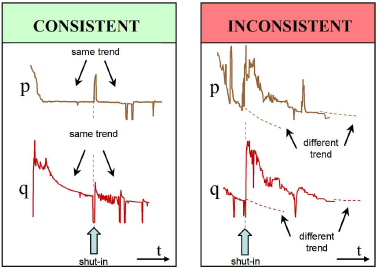
Is the trend in rate and pressure consistent?
|
|
See the trend correlation on the rate & pressure vs time plot. |
|
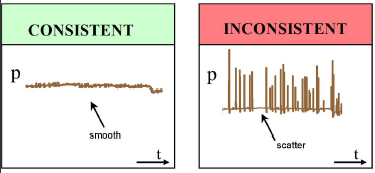
Is the data smooth?
|
|
See the stable data and continuous smooth data plots on the rate & pressure vs time plot. |
|
Have the outliers been removed?
|
|
See the continuous smooth data plot on the rate & pressure vs time plot. |
|
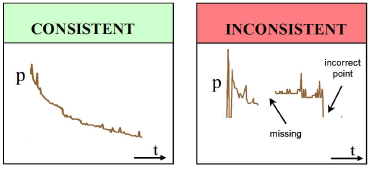
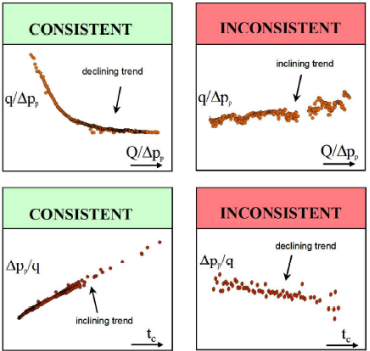
Does the Blasingame graph continuously decline?
|
|
See the Blasingame and NPI plots |
|
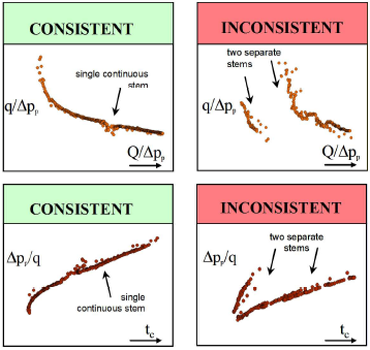
Do the Blasingame or NPI plots contain a single continuous stem?
|
|
See the Blasingame and NPI plots |
|
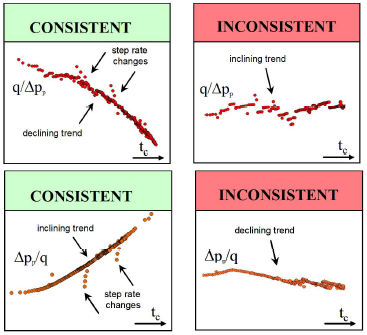
Does the FMB rate plot trend decline?
|
|
See the FMB rate and FMB pressure plots |
|
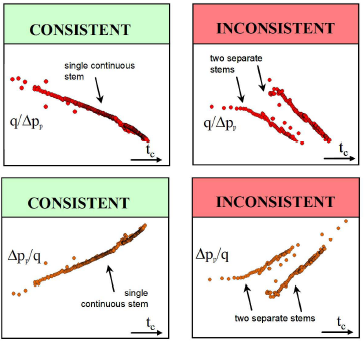
Do the FMB rate or pressure plots have a single continuous stem?
|
|
See the FMB rate and FMB pressure plots |
|
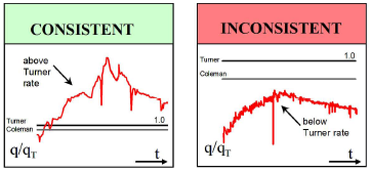
Is the gas rate above the critical Turner rate?
|
|
See the Turner rate plot |
|
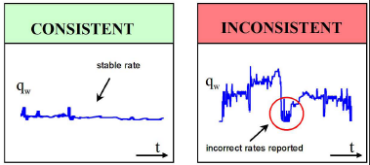
Is the water rate reported?
|
|
See the WGR & water rate plot |
|
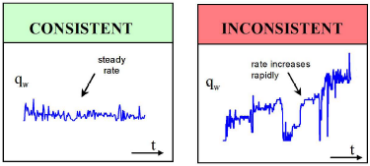
Is the water rate free of rapid increases?
|
|
See the WGR & water rate plot |
|
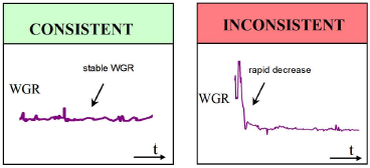
Is WGR free of rapid decreases?
|
|
See the WGR & water rate plot |
|
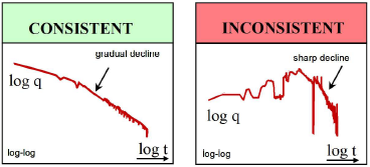
Is the gas rate on the log-log plot free of sharp declines?
|
|
See the log gas rate plot |
|
Finish. Proceed to analysis |