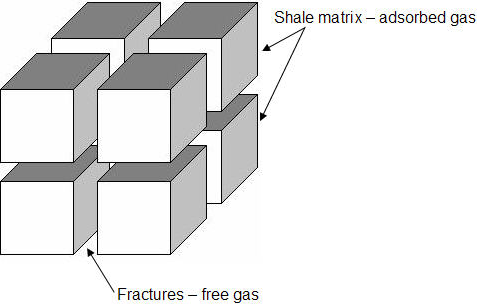
Tight / shale gas reservoirs have very low matrix permeability, and in some instances contain organic-rich rocks where gas can also be adsorbed. For additional information, see shale adsorption correction. Production from these reservoirs requires long horizontal wells with multiple- staged hydraulic fracture treatments to create extensive artificial fracture networks near the wellbore.
To estimate original gas-in-place in tight / shale gas reservoirs, you require:
- Conventional volumetric calculations using rock volume, porosity, fluid saturations, and pressure.
- Use of Langmuir isotherms to estimate the volume of adsorbed gas.
Typically, all water in a tight / shale gas reservoir is not moveable, so the reported water production is almost always attributable to production of load fluids (completion / fracture treatment fluid).
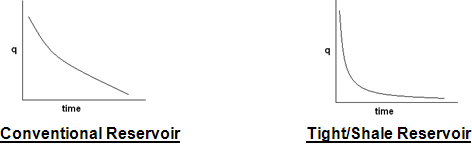
Conventional vs. tight / shale gas reservoirs
A comparison of conventional and tight / shale gas reservoirs is shown below:
| Characteristic |
Conventional |
Shale |
|---|---|---|
|
Gas Generation |
Gas is generated in the source rock and then migrates into the reservoir. |
Gas is generated and trapped within the source rock. |
|
Gas Storage Mechanism |
Compression. |
Compression and adsorption. |
|
Gas Produced |
Free gas only. |
Free and adsorbed gas. |
|
Production Performance |
Minimal transient period followed by a long boundary-dominated flow period. Production rates are mainly related to permeability and declining reservoir pressure. From a traditional decline perspective, ‘b’ values typically range from 0 to 0.5 but can be somewhat larger if there are commingled layers. Recovery factor = 50% – 90% |
Very long transient (linear) flow period that can extend many years. In some cases, it is debatable if boundary-dominated flow will ever be fully realized. Production rates are mainly related to the success of creating a large fracture network around a long horizontal wellbore and to the matrix permeability. From a traditional decline perspective, ‘b’ values initially equal 2.0 (indicating linear flow), and then transition to <1.0 as boundary-dominated flow becomes prevalent. Recovery factor = 5% – 20% |
A comparison of conventional vs. tight / shale gas rate-time plots is shown below:
Shale adsorption correction
The shale adsorption correction is based on SPE paper 131772 by R. Ambrose et al.
In shale reservoirs that display adsorption, it has traditionally been thought that the adsorbed gas resides in the matrix of the organic-rich portion of the rock, which does not contribute significantly to the porosity of the rock. New evidence (Ambrose et al.) suggests that this organic-rich portion of the shale does, in fact, contain the majority of the porosity, as well as the adsorbed gas. If this assumption is valid, it is possible that the adsorbed gas is occupying a portion of the measured porosity, thus decreasing the pore space available to free gas. The volume occupied by the adsorbed gas must therefore be subtracted from the measured pore volume when calculating the volume available for free gas storage. The Ads. Sat. (Adsorption Saturation) option in Harmony Enterprise performs this correction.
When gas is adsorbed, the molecules are so close to each other that they exist in a near liquid phase. The adsorption volume correction in Harmony Enterprise converts the measured adsorbed gas content into a liquid, and subsequently treats this phase as an extra saturation term, similar to water saturation.
When the correction is enabled, an Adsorbed Saturation, “Sads” is calculated, and gas saturation is calculated as follows:

To calculate adsorbed saturation, define:

The adsorbed saturation can therefore be calculated as follows:

From SPE 131772,  is defined as:

where
 = Fractional volume occupied by adsorbed phase
M = Molecular weight of the gas (lbm/lbmole)
VL = Langmuir Volume (scf/ton)
pL = Langmuir Pressure (psi(a))
pi = Initial reservoir pressure (psi(a))
 = Bulk density of the rock (g/cm3)
 = Density of the adsorbed phase (g/cm3)
| Note: |
 is the density of the adsorbed “liquid” phase. The default in Harmony Enterprise for this value corresponds to the liquid methane density of 0.42 g/cm3. is the density of the adsorbed “liquid” phase. The default in Harmony Enterprise for this value corresponds to the liquid methane density of 0.42 g/cm3. |
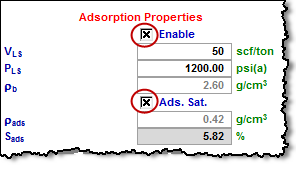
The adsorption saturation correction is available for gas volumetric and gas analytical models. In gas volumetric analyses, the correction is available under Adsorption Properties. To use the correction, click the Enable checkbox and then the Ads. Sat. checkbox.
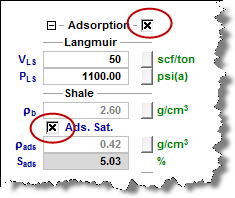
In gas analytical models, click the Adsorption checkbox, then click the Ads. Sat. checkbox.
Enabling the Ads. Sat. correction results in an adsorbed saturation (Sads) being calculated, which in turn is subtracted from the original gas saturation (Sg). This corrected gas saturation is now used in the volumetric calculations to calculate a new free-gas OGIP.