The ratio trend is used to create linear forecasts of fluid ratios vs time. These can be linked to decline analyses to create rate forecasts in place of analyzing secondary fluids independently. The ratio trend is not based on a model or equation, and you should consider the fluid properties of a reservoir in order to constrain forecasts.
The supported ratios include gas-oil ratio (GOR), water-oil ratio (WOR), condensate-gas ratio (CGR), and water-gas ratio (WGR). On a worksheet that includes one of these ratios plotted against date time or cumulative time, the corresponding ratio trend is available to add in the Analysis Manager by clicking the + icon.
| Note: | This analysis works with your Harmony Forecast™ license. |

Analysis Parameters pane
After you add your ratio trend, the selected analysis (highlighted in grey) has its detailed parameters displayed in the Analysis Parameters pane located below the Analysis Manager pane. (This is the default setting.)
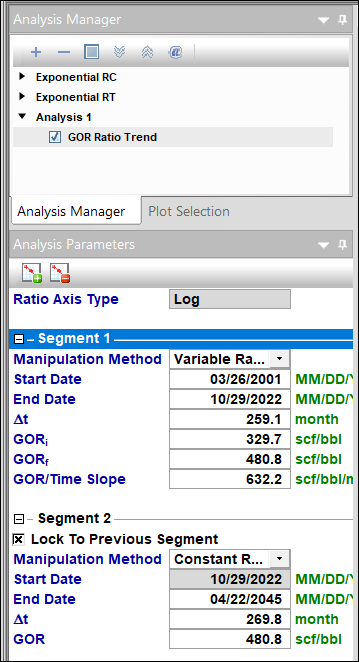
Harmony Enterprise initially best fits your ratio trend based on all the production history of the ratio.
In this pane, you can view the following setting:
Ratio Axis Type —displays Log or Coordinate, depending on the axis type you set for the ratio on the worksheet when you created the ratio trend. The ratio trend can be displayed on the other axis type, but it will appear in grey, as a display-only analysis that cannot be modified. It does not appear as a straight line when the axis type is switched, as it is linear only on the axis type it is created on.
Multiple segments
You can add multiple segments (see Analysis Parameters toolbar) to your ratio trend, and under each segment, you can change parameters and the manipulation method for that segment.
Under each segment's tab, you can specify / view the following parameters:
- Manipulation Method — select Variable Ratio for linearly increasing or decreasing ratios, and select Constant Ratio for a fixed value. The default settings is Variable Ratio.
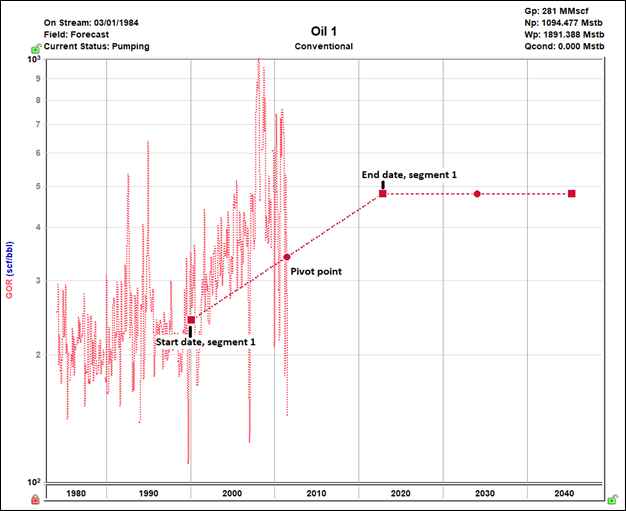
- Start Date — the start of the ratio trend is indicated by a left square on the analysis line.
- End Date — the end of the ratio trend is indicated by a right square on the analysis line.
- Δt — the duration of the ratio trend from the start date to the end date.
- Initial Ratio — the initial ratio value at the start of the ratio trend. This is displayed as a ratio acronym (such as GOR) with the subscript ‘i’ and is only applicable to the Variable Ratio.
- Final Ratio — the final ratio value at the end of the ratio trend. This is displayed as a ratio acronym (such as GOR) with the subscript ‘f’ and is only applicable to the Variable Ratio.
- Slope — for the Variable Ratio trend, this is the difference between the final and initial ratio divided by the duration.
- Ratio — a Constant Ratio trend shows the ratio value used over its duration with a ratio acronym (such as GOR).
- Lock To Previous Segment — on secondary segments, when this option is on the initial ratio, it is locked to the final ratio of the previous segment, and both remain synchronized through any analysis modifications.
Analysis Parameters toolbar
The Analysis Parameters toolbar has the following key icons
![]() /
/ ![]() Add Segment / Remove Segment — adds a new segment to the end of the existing ratio trend, or removes the last segment. When you add a new segment, it initializes as a Variable Ratio with the same starting value and slope of the previous segment. The duration of new segments is 60 months (5 years).
Add Segment / Remove Segment — adds a new segment to the end of the existing ratio trend, or removes the last segment. When you add a new segment, it initializes as a Variable Ratio with the same starting value and slope of the previous segment. The duration of new segments is 60 months (5 years).
Line manipulation
Line manipulations are initiated by clicking the line itself, or one of the manipulation points for a given segment (start date or end date). Specific line manipulations are described below.
Start Date (indicated by a left square)
- Click, grab-and-drag — moves the line vertically and horizontally (4-direction pan) to change the start date and the initial ratio. The slope is changed, but the end-date point stays fixed.
- On a Constant Ratio segment, this only moves horizontally and changes the start date.
End Date (indicated by a right square)
- Click, grab-and-drag — moves the line vertically and horizontally (4-direction pan) to change the end date and the final ratio. The slope is changed, but the start-date point stays fixed.
- On a Constant Ratio segment, this only moves horizontally and changes the end date.
Any point on the line (activated when the segment turns orange)
- Click, grab-and-drag — rotates the line about the pivot point. Both initial and final ratios are changed, but the start and end dates are fixed. This is not available for Constant Ratio segments.
Pivot point (indicated by a circle)
- Click, grab-and-drag — moves the line vertically while the slope is maintained. The pivot point can also move along the line to change its position.
Linking to a Decline analysis
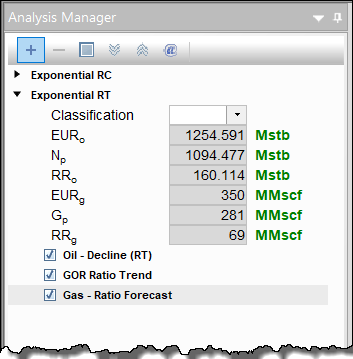
After you have created a Ratio Trend, you can link it to a decline analysis to calculate a rate forecast. For example, linking a GOR and oil decline calculates a gas rate forecast. This can be done by clicking the … button next to the analysis in the Analysis Manager. For more information, see Analysis type menu.
For each ratio, either fluid can be linked to calculate the other, but only traditional and multi-segment declines are used. Duong, Stretched Exponential, and other forecast types do not generate a rate forecast with a ratio trend. The rate forecast is calculated from the decline’s Forecast Start Date to End date. If the Ratio Trend does not extend over the same duration, a fixed value of the ratio is extrapolated to fill the gap.
The calculated rate appears as an item in the Analysis Manager (selected below) that can be displayed on a worksheet with its rate, or on the Forecast worksheet.
If the decline or ratio trend is removed from the parent analysis or deleted, the rate forecast is deleted. Another analysis that generates a rate forecast of the same fluid type cannot be linked to the analysis after the rate forecast is created.
The rate forecast can be exported. For more information, see export forecasts. When the ratio trend is linked to an appropriate decline, it can also be exported to ARIES. For more information, see export decline parameters.
An ARIES export supports the following combinations:
- GOR + oil decline
- GOR + gas decline (exported as OGR)
- WOR + oil decline
- CGR + gas decline
- WGR + gas decline
Analysis-line customization
You can customize the width and color of your decline line / curve by right-clicking it.
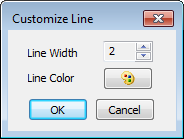
After you customize your decline line / curve, the modifications are saved and applied to every worksheet that displays this decline.