There are several methods you can use to manipulate your decline curve.
When manipulating the decline curve, there are three data points to
be aware of.
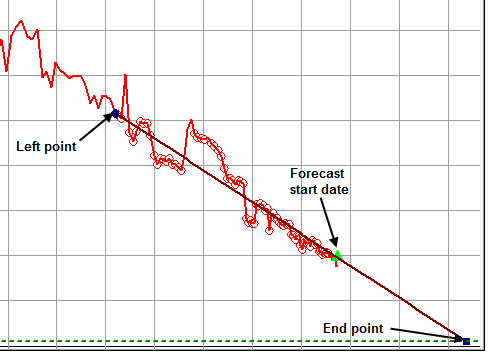
1. Left point — any historical data point. (The section between the left point and the forecast start date is not included in the forecast; it is only used to show the match to historical production.)
2. Forecast Start Date — the middle point on the line; this is the forecast start date (FSD).
3. End point — the expected ultimate recovery.
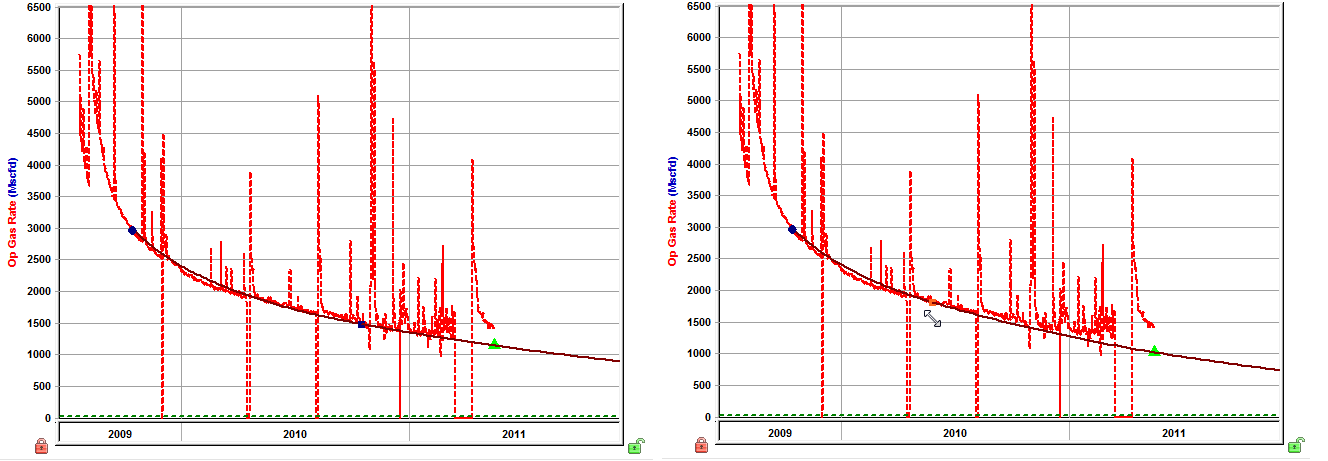
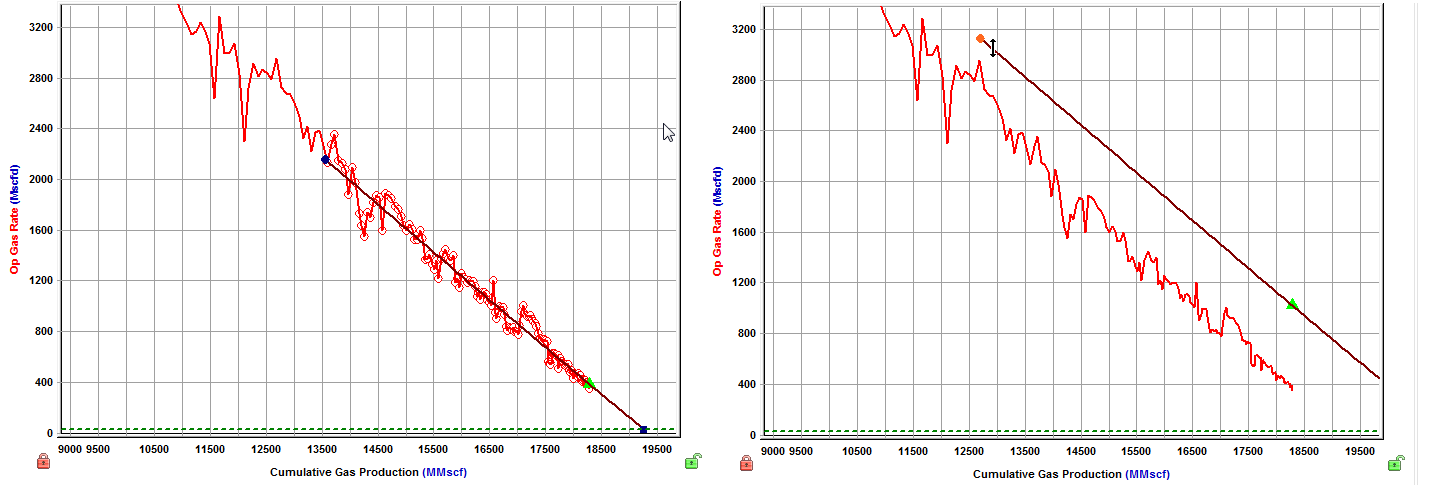
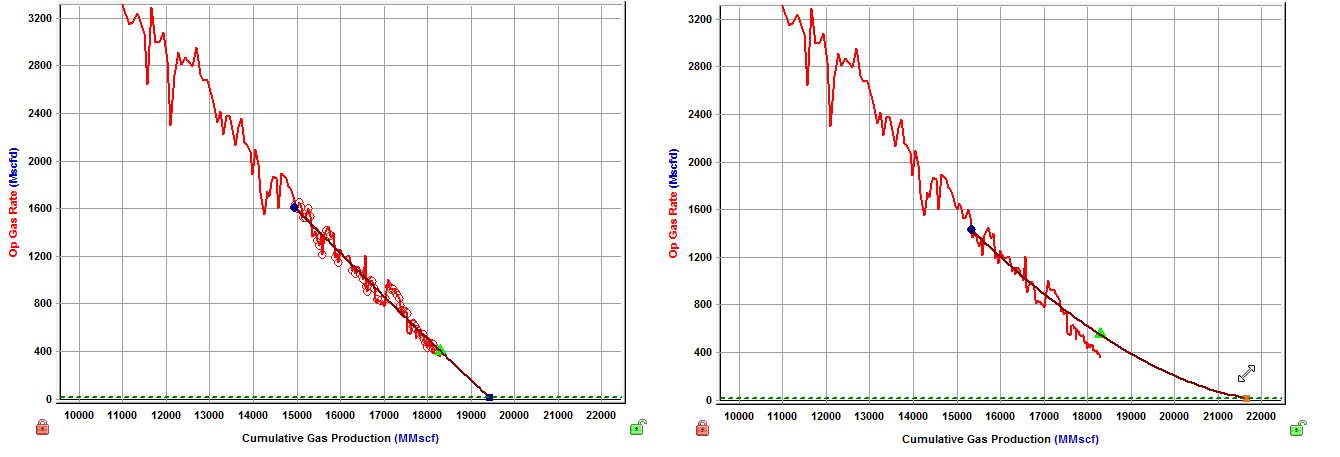
Changing the slope of the decline curve
To change the slope of the decline curve, click the decline curve line and drag. The line pivots around the FSD point, changing the decline rate and forecast duration. (If you drag the segment that does not have the FSD within it, the line pivots around the segment's start point.)
Changing the historical match
To change the historical match, click the left point while pressing the Shift key, and then drag it to a new position. This changes the portion of the historical production data used, but it does not change the analysis.
Changing the initial rate
To change the initial rate, click-and-drag the left point up or down. The initial rate and forecast duration change. Alternatively, you can click-and-drag the FSD point up or down.
Changing the FSD
To change the FSD, enter a new date in the Forecast Start Date field in the Analysis Parameters pane.
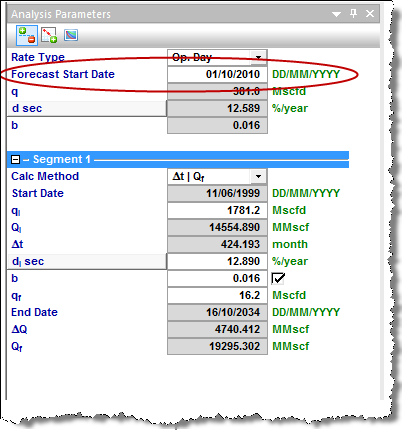
If you click-and-drag the FSD point left or right while holding down the Ctrl key, the FSD point moves together with the decline curve.
If you click-and-drag the FSD point left or right while holding down the Shift key, the FSD point moves along the decline curve (the curve itself does not move).
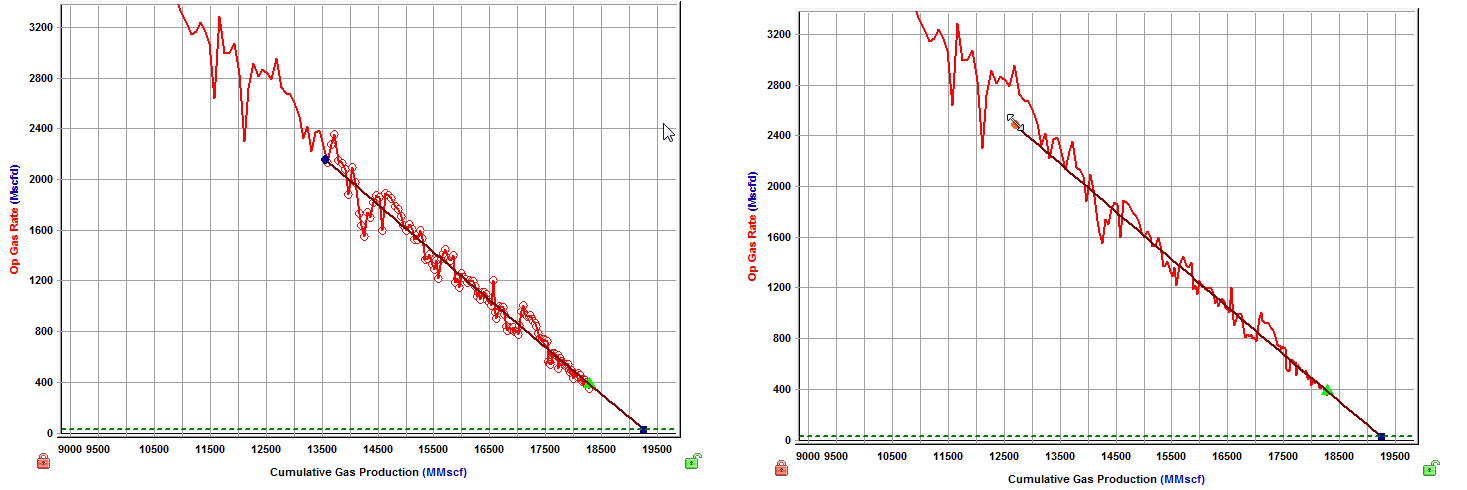
Changing initial cumulative production & final cumulative production
To change the initial cumulative production and final cumulative production, click-and-drag the left point while holding down the Ctrl key. This changes the start point without changing the initial oil / gas rate or decline rate.
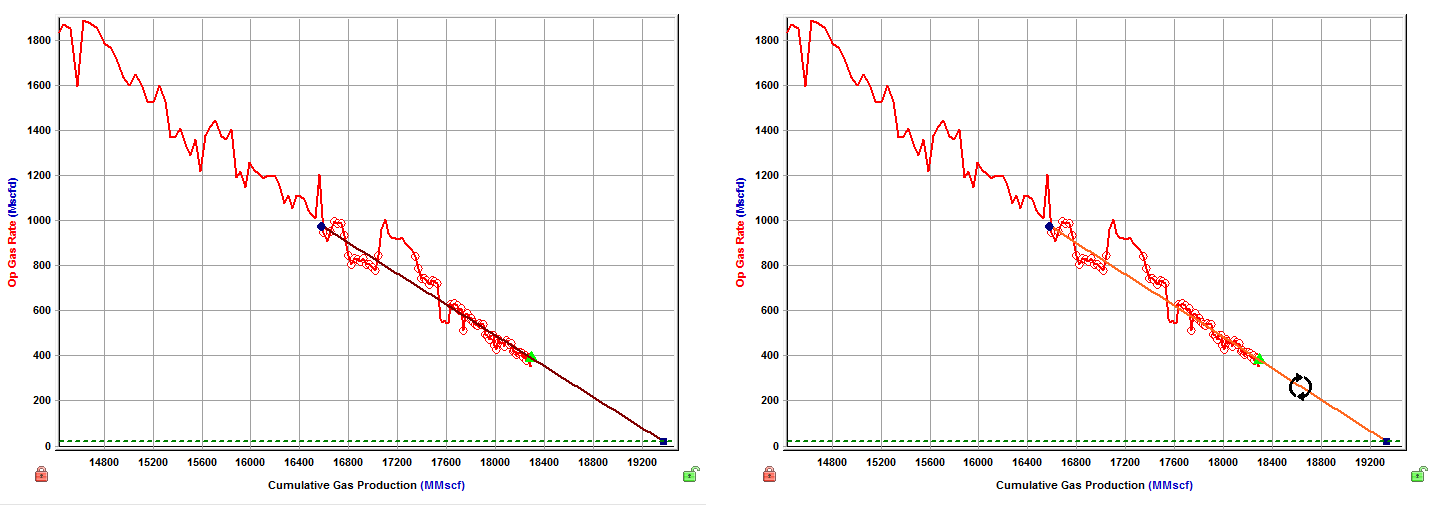
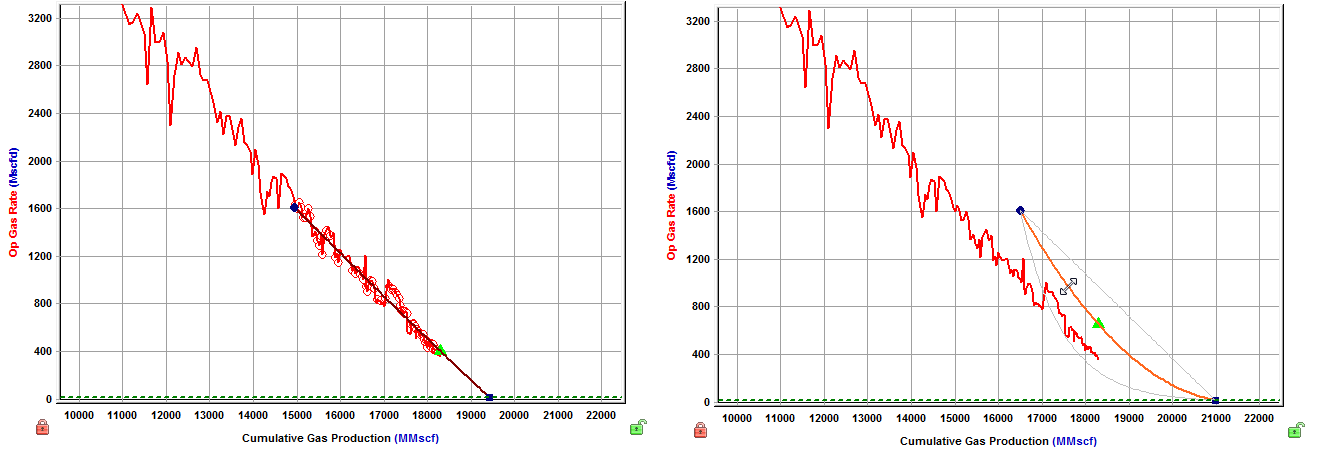
Changing the b value
To change the b value, click-and-drag the decline curve while holding down the Ctrl key. This changes the decline exponent value and the start point, while the left point and end point remain fixed. (The gray guidelines represent decline exponents of 0 and 1.)
Changing the b value & final cumulative production
To change the b value and final cumulative production while maintaining the initial gas / oil rate, drag the end point while holding down the Ctrl key. (This method does not show the gray guidelines.)
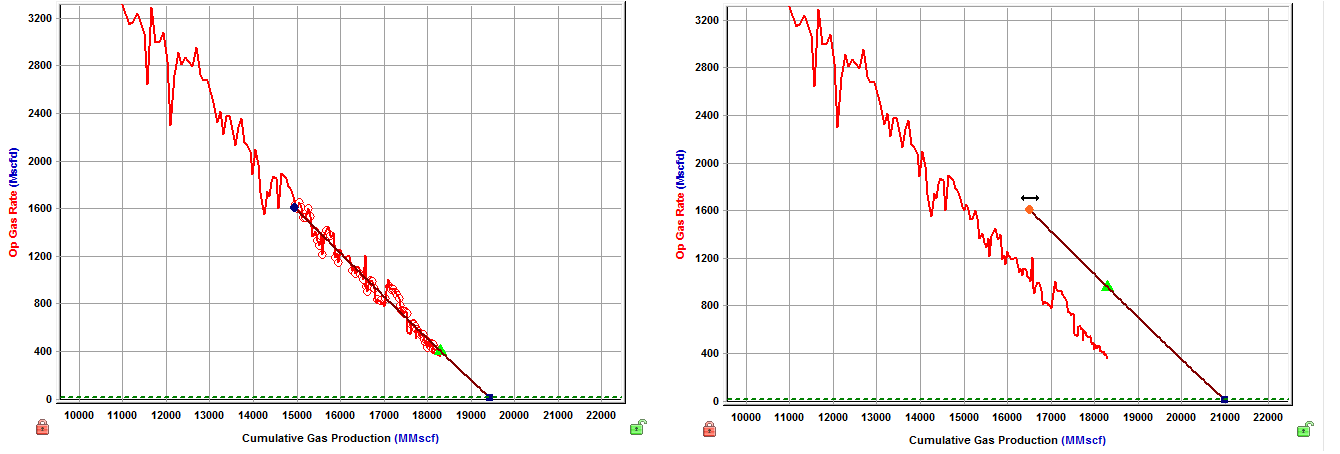
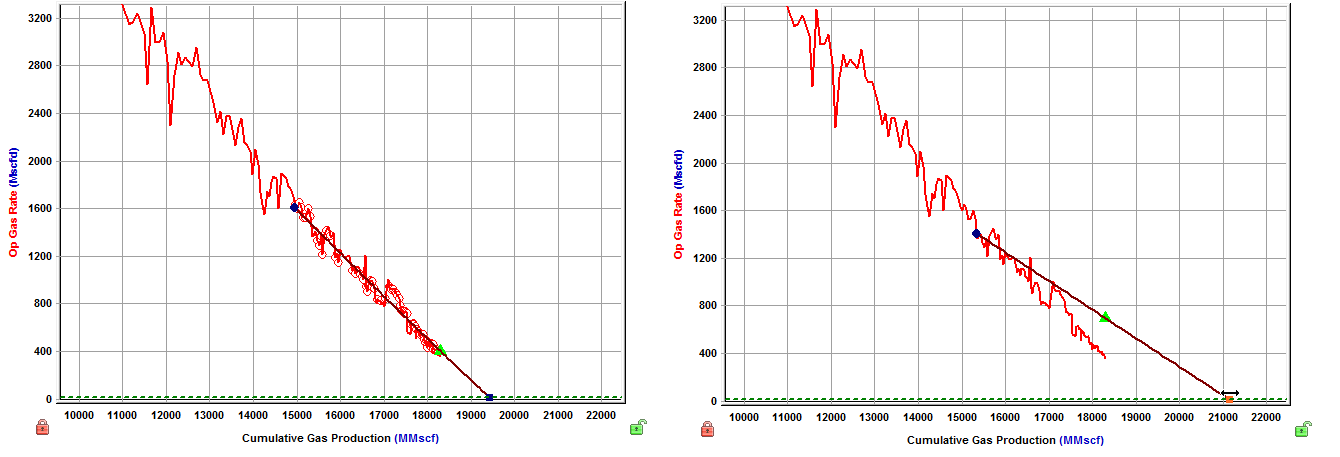
Changing final cumulative production & decline rate
To change the final cumulative production and the decline rate, drag the end point left or right. This changes the cumulative production of the segment and the forecast duration, without changing the final rate. The initial gas / oil rate and decline rate are also changed.
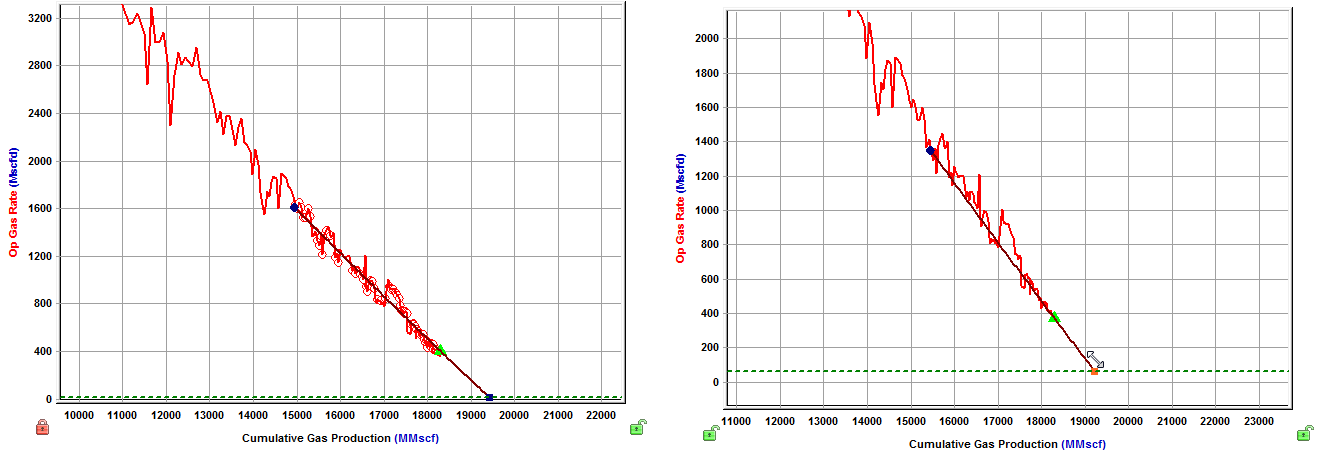
Changing the abandonment rate
To change the abandonment rate, drag the end point while holding down the Shift key. The final rate, cumulative production, and forecast duration are changed without changing the decline exponent, or effective decline rate.
Manipulating multiple segments
Individual segments can be best fit to the corresponding data interval by using the data selection tool, and selecting data points between the start and end date of that segment.
Alternatively, selecting data points that span multiple segments best fits each segment to the points that lie between their individual start and end dates.
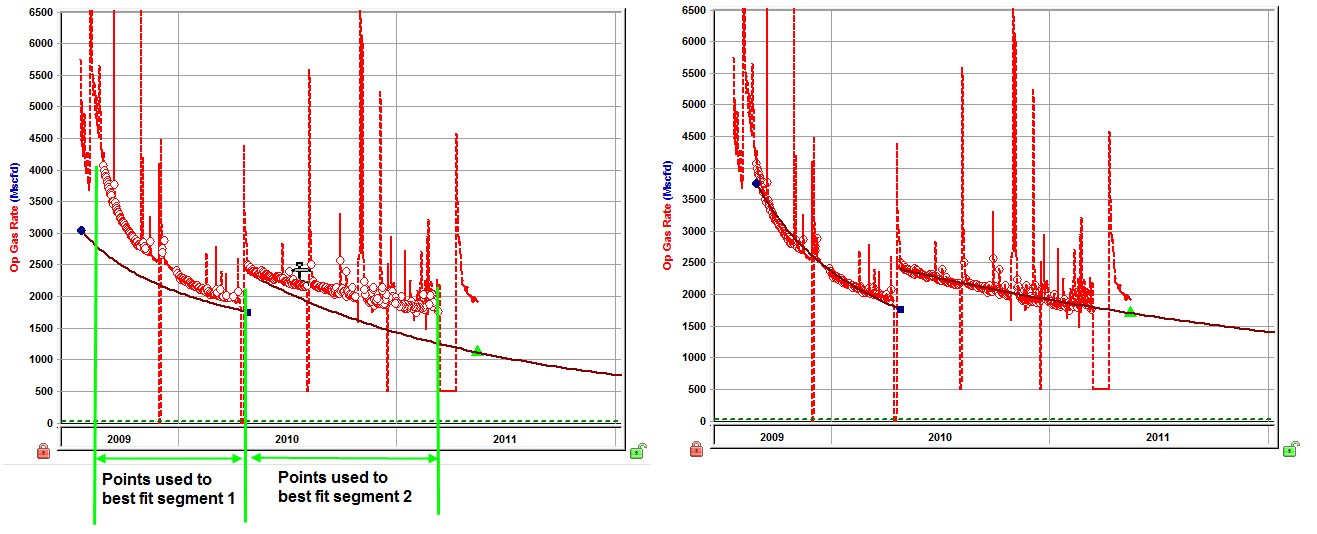
When best fitting using the data selection tool, the start date of the first segment corresponds to the first data point that is selected. The end date of the first segment can be changed by clicking-and-dragging the point left or right.
The end date of the first segment corresponds to the start date of the second segment. These dates are always be the same; however, the initial rate of the second segment does not necessarily have to be the same as the final rate of the first segment. (Additional segments can be added as needed.)
Manipulating a multi-segment decline
A multi-segment decline is initially "best fit" using all data points as follows:
- with the start date of the first segment equal to the start of production
- the end point of the first segment defined by the constraints entered in the Options dialog box
- the start date of the second segment equal to the end date of the first segment
- the end date of the second segment defined by the final gas rate
The first and second segments are always continuous, with the end date of the first segment equal to the start date of the second segment. As well, the instantaneous decline rate at the end of the first segment is equal to that at the beginning of the second segment.
Due to the continuity between the first and second segments, manipulating the shape of the first segment's decline curve impacts the second segment's decline curve.
All line manipulations described above can be applied to the multi-segment decline analysis. The length of the first decline segment can be changed by clicking the end point of the first segment and dragging left or right.