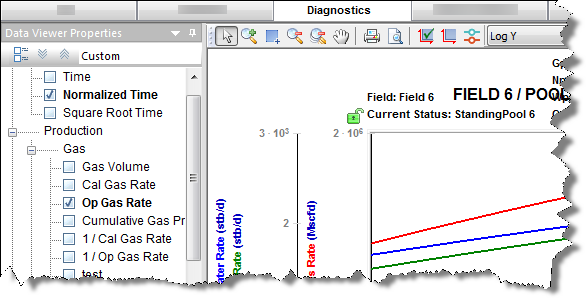
The Diagnostics tab displays customizable plots consisting of production, injection, and pressure data for each well or scenario in a Harmony Enterprise project. Selecting parameters in the Data Viewer Properties pane displays these items on the plot.
- If you select more than one entity, the selected data from all these entities is displayed in the diagnostic plot.
- Hovering your mouse over selected entities in the Entity Viewer (Hierarchy or Custom) makes their plot lines become bold.
You can send your plot to a comparison plot, by right-clicking it and selecting Send Plot to Comparison Plot. You can also right-click a dataset in the plot and select Send Dataset to Comparison Plot. For information on other options, see plot options and locks.
| Note: | If a custom dataset does not exist when a template is applied, the dataset is not added to the plot. |
Toolbars
This tab has two toolbars: a primary toolbar for the Data Viewer Properties pane and a secondary toolbar above the plot. For a description of common icons, see toolbars.
Primary toolbar
The important item on this toolbar is the Template drop-down list.
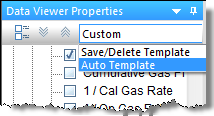
Auto Template is the default setting, but you can select Save / Delete Template in order to create a template with the plot selections / datasets you prefer. This template can also be used in a custom worksheet to perform a decline analysis or ratio analysis. For more information, see the Save Template dialog box.
Secondary toolbar
The secondary toolbar is above the plot, and in addition to the common toolbar items, has the following items:
-
 Toggle Coloring by Entity or Dataset — displays unique colors for entities / datasets. In other words, entities can use the default colors (red for gas, green for oil, etc.), or every dataset can have a unique color. (This feature is available in a diagnostic plot with multiple wells selected.)
 - Plot drop-down list — select your plot type (semi-log vs. coordinate).
Context menus
Right-clicking within the Data Viewer's tree structure displays the same context menu as for a pane.
Right-clicking within the Diagnostic plot (the main pane) displays plot options.