Data reduction is the process of reducing high-frequency data prior to importing. This dialog box opens when the number of production rows in a well reaches the threshold defined in the Options dialog box (or the default value of 50,000), or if you have selected the Always Display option.
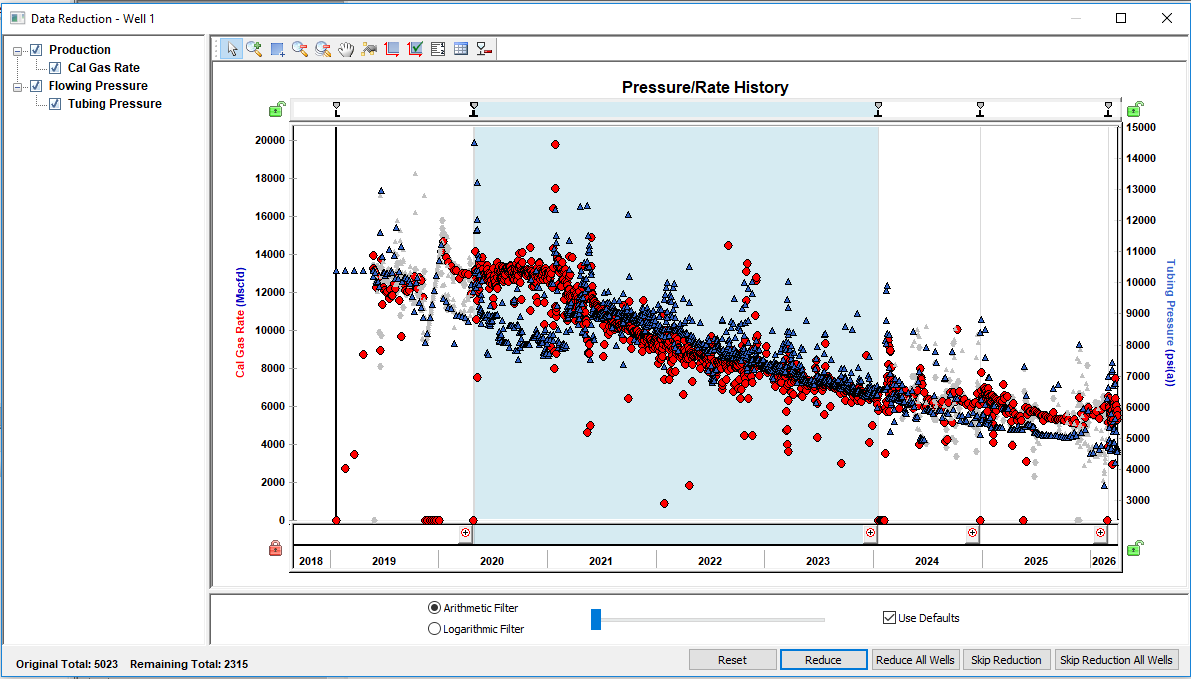
The plot displays the production data categorized automatically with flowing and shut-in periods ("ranges"). Note that automatic detection thresholds for flowing and shut-in periods can be set in Data Reduction options.
The selection tree displays the incoming production data, including producing rates, injecting rates, volumes, and pressure data.
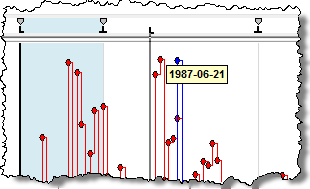
Hovering your mouse over an empty portion of the plot displays the number of points originally in that range, and how many are remaining after applying the current filter. Hovering over a range displays whether you are in a flowing or shut-in period, and whether the range uses default settings. Hovering the mouse over a data point displays that data point's type and date.
With the slider, you can apply a smaller or greater amount of data reduction based on either an arithmetic or logarithmic filter. The slider only applies to the selected range (which is displayed darker on the plot). If you select the Use Defaults option, the selected range is filtered based on the default settings.
Toolbar
This dialog box has the following unique icons:
-
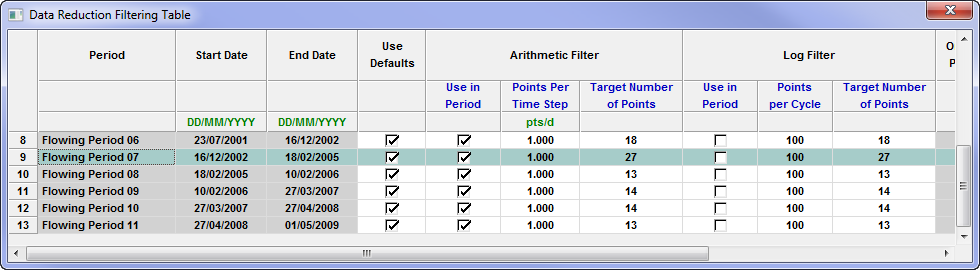
 Display Data Reduction Filtering Table — displays the original and remaining points in each range, and running totals of both. You can select or deselect checkboxes, or click inside a field and enter custom values.
 -
-
 Merge All Ranges — copies the filter settings to all ranges. For more information, see adding, resizing, and merging ranges.
For information on common plot icons, see plot toolbars.
Zoom
You can zoom into a range by clicking the Zoom icon (![]() ) in the lower right corner of every range.
) in the lower right corner of every range.
![]()
To zoom out of the range, click one of the Zoom Out icons.
Buttons
This dialog box has the following buttons:
- Reset — resets this dialog box to its initial configuration.
- Reduce — reduces the current well's data based on that well’s reduction criteria.
- Reduce All Wells — reduces the current well's data based on the well's reduction criteria, and all other wells based on the default reduction criteria.
- Cancel — imports the current well without applying reduction.
- Cancel All Wells — imports all wells without applying reduction.
Adding, resizing, and merging ranges
To add a range:
Click inside the range area just above the main plot area. A marker opens.
To resize a range:
Drag the range marker to the left or right.
Note: You can move any range marker except those at the furthest left and right.
When you merge a range, you copy the filter settings from one range to the next range.
To merge a range:
Click the Merge All Ranges icon (![]() ) in the main toolbar.
) in the main toolbar.
Or, right-click a marker and select Merge Left or Merge Right.