With water-oil ratio (WOR) worksheets you can use oil ratios vs. cumulative oil or vs. time, to forecast oil and water rates in a high-water cut. In these cases, abandonment criteria is often related to both oil and water production. By providing the total fluid rate, forecasts for oil and water are calculated.
| Note: | This worksheet works with your Harmony Forecast™ license. |
For more information, see water-oil forecasting theory.
You can select from the following default worksheets:
- WOR vs. Cumulative Oil — presents the water-oil ratio (WOR) from a historical perspective. It has little or no analysis value. The WOR + 1 analysis curve can be presented on this plot.
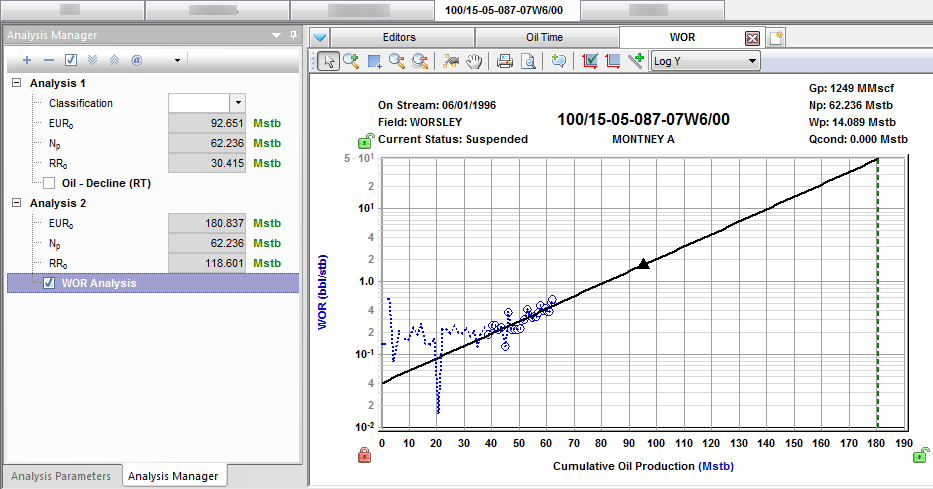
- WOR + 1 vs. Cumulative Oil — this is our main analysis plot for estimating oil EUR by extrapolating the linear portion of the WOR + 1 trend. This plot is used because it helps ensure you only use the data where water cut exceeds 50% and it tends to produce more reliable linear trends. This plot can be used directly to extrapolate EUR because the x-axis is cumulative oil, or it can be used as a trend line in the Forecast worksheet to create an oil-rate forecast based on a projection of Total Liquids Rate (Oil + Water). This is a crude, but workable method.
- Water cut vs. Cumulative Oil — water cut can be defined as the ratio of water produced compared to the volume of total liquids produced. The water cut in water-drive reservoirs can reach very high values (from the Schlumberger Oilfield Glossary).
- Oil cut vs. Time — is a method sometimes used for wells with very high WORs to linearly extrapolate similar oil rates to an economic oil-cut limit. It can be very dangerous because it encourages you to identify and extrapolate trends that may be partially or entirely created by measurement errors, and not due to progressive saturation changes in the reservoir.
You can add your own worksheets, but the WOR analysis can only be added when the required axes are present.