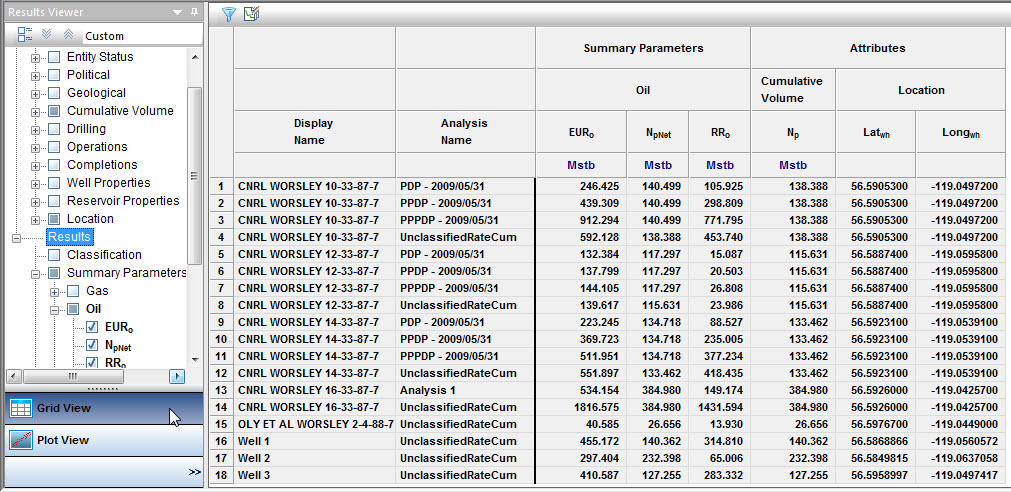
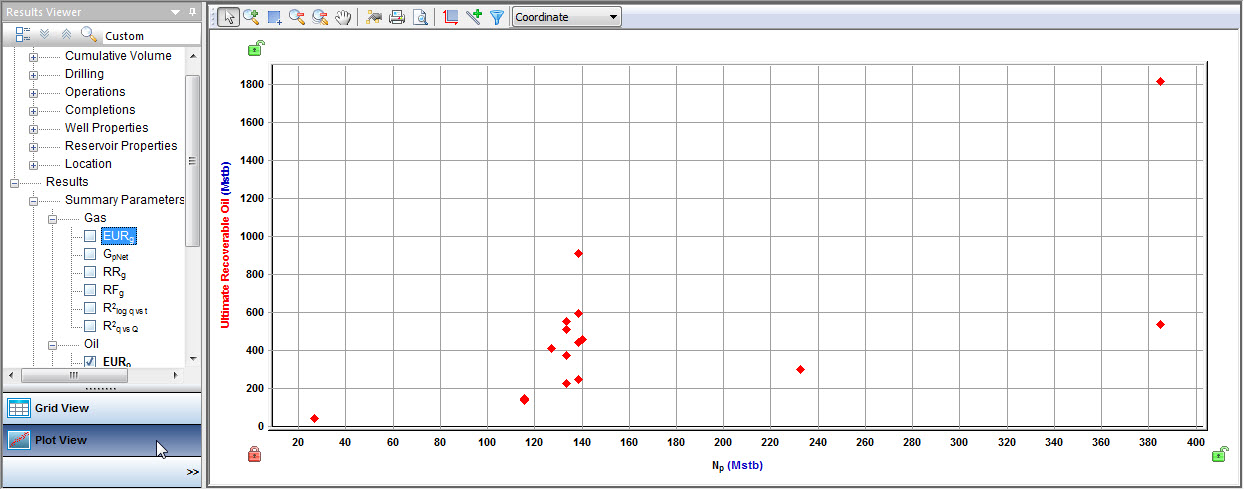
After you perform an analysis, you can view the results of multiple analyses from one or more wells on the Results tab. These results can be viewed in a tabular format using the grid view, or graphically in a cross plot using the plot view. Well attributes can also be displayed in conjunction with the analysis results in both views.
Grid view
To view your results in grid view:
1. Select one or more wells or groups from the Entity Viewer (Hierarchy or Custom pane), or the GIS tab, and then click the Results tab.
2. Click the Grid View navigation button at the bottom of the Result Viewer pane.
3. Select the parameters you want to display by selecting the appropriate checkboxes in the Results Viewer pane (tree structure).

Plot view
To view your results in plot view:
1. Select one or more wells or groups from the Entity Viewer (Hierarchy or Custom pane), or the GIS tab, and then click the Results tab.
2. Click the Plot View navigation button at the bottom of the Result Viewer pane.
3. Select the parameters you want to display by selecting the appropriate checkboxes in the Results Viewer pane (tree structure).
Or, you can drag-and-drop the parameters to the plot.
