The normalized pressure integral (NPI) was initially developed by Blasingame et al. (1989). The objective of the method was to present a robust diagnostic method for drawdowns that did not suffer from noise and data scatter, as is typical of the standard well-test derivative. The solution involves using a pressure integral curve as the base curve for noisy drawdown analysis.
The dimensionless pressure integral is defined as follows:

where:

Conceptually, the pressure integral is a "cumulative average flowing pressure drop" (see also rate integral). The distinguishing characteristic of the pressure integral is its smoothness. Thus, it is an ideal base curve for the standard pressure derivative if the raw data contains any degree of noise or scatter.
The dimensionless pressure integral derivative is defined as follows:

Below is a graph of the three dimensionless typecurves (that is, pD, pDi and pDid), representing the solution for a vertical well in the center of a bounded reservoir (circle).

Methodology
Modifications in RTA
The original development of pressure integral typecurves was for pressure transient analysis. However, the theory can be extended to production data analysis (Rate Transient Analysis), using the following concepts:
As a production data analysis method, the normalized pressure integral has the advantage of blending seamlessly with transient well-test interpretation. In fact, the diagnostic plot is equivalent to that of an extended drawdown test. The perspective is quite different from decline curves, and provides a useful benchmark for comparison of results.
Data preparation
In normalized pressure integral typecurve analysis, the following three rate functions can be plotted against material balance time.
Normalized pressure
Oil wells

Gas wells

Normalized pressure integral
The pressure integral is defined at any point in the producing life of a well, as the average normalized flowing pressure drop at which the well has produced until that moment in time. The normalized pressure integral is defined as follows:
Oil wells

Gas wells

Pressure integral derivative
The pressure integral derivative is defined as the semi-logarithmic derivative of the pressure integral function, with respect to material balance time. It is defined as follows:
Oil wells

Gas wells

Analysis
The actual normalized pressure, pressure integral, and pressure integral derivative are plotted vs. material balance time data on a log-log scale of the same size as the typecurves. This plot is called the “data plot”. Any convenient units can be used for normalized rate or time because a change in units simply causes a uniform shift of the raw data on a logarithmic scale. It is recommended that daily operated-rates be plotted, and not the monthly rates, especially when transient data are analyzed. Any one of the curves can be used individually but often using more than one curve helps in achieving a more unique match of the data with the typecurves.
The data plot is moved over the typecurve plot, while the axes of the two plots are kept parallel, until a good match is obtained. The pressure, pressure integral, and pressure integral derivative data should all fit the same corresponding typecurve. Several different typecurves should be tried to obtain the best fit of all the data. The typecurve that best fits the data is selected and its re / rwa (re / xf for fractured case) value is noted.
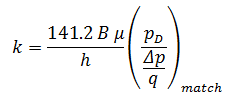
Typecurve analysis is done by selecting a match point, and reading its co-ordinates off the data plot (Δp / q and tca) match, and the typecurve plot (pD and tDA) match. At the same time the stem value re / rwa (re / xf for fracture typecurves) of the matching curve is noted. To create a forecast, the selected typecurve is traced on to the data plot, and extrapolated. The future rate is read from the data plot, off the traced typecurve.
Given a curve match, the following reservoir parameters can be obtained if net pay, total compressibility, and wellbore radius are known: permeability, skin (or fracture half length, depending on which model is chosen), area, and original fluids-in-place.
Calculation of parameters
Radial typecurves
Oil wells


Gas wells


Fracture typecurves
The NPI fracture typecurves are the inverse of the Agarwal-Gardner rate-time fracture typecurves.