TPC
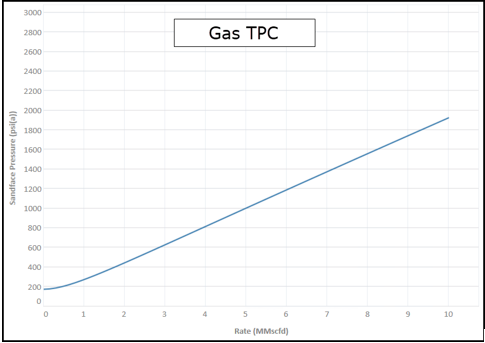
A tubing performance curve (TPC) is a graphical representation of the pressure response of a wellbore completion to a range of fluid rates. With a Harmony Optimize license, you can plot a TPC as a relationship between sandface flowing pressure vs. gas rate.
The inputs needed to create a gas TPC curve are as follows:
- Wellhead pressure
- Ratios (OGR and WGR)
- A valid wellbore configuration
- See the Wellbore editor for details.
- Valid fluid properties
- See the Properties editor for details.
Using these inputs, a series of pressure loss calculations are done over a range of gas rates, and then a line is drawn through all the points to create a curve. The default setting is to plot 64 points, using equally spaced gas rates up to a maximum rate defined by the largest inflow performance relationship (IPR).
Simplified C, n deliverability
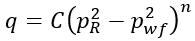
Simplified C,n deliverability (also known as the Rawlins-Schellhardt equation) uses the back-pressure equation to define the well's deliverability. The back-pressure equation is an empirically derived industry standard that applies to gas wells, independent of reservoir drive. It is generally derived from a well test (for example, isochronal test). The back-pressure equation is stated as:
where:
q = flow rate, MMscfd or 103m3/d
C = constant, MMscfd /(psi2)n or (103m3/d/kPa2)n
n = turbulence of flow, dimensionless
pR = reservoir pressure, psia or kPaa
pwf = sandface flowing pressure, psia or kPaa
“C” value
The “C” value defines the magnitude of the well's rate response to changes in pressure.
“n” value
The "n" value describes the effect of turbulence in the near-wellbore region. Wells that are operating at high drawdowns, or wells with high permeability, can experience significant energy loss in the near-wellbore region due to the development of turbulent flow from the high gas velocities. The “n” value helps account for this effect.
An "n" value equal to 1 describes completely laminar flow (no turbulence), and an "n" equal to 0.5 describes a very turbulent flow. In practice, values equal to 1 or 0.5 are not seen, but it is fairly common industry practice to use an n of 1 on low-to-mid deliverability gas wells that are not expected to operate at low drawdowns, and thus, where turbulent effects are minimal.
Values of n closer to 0.5 are most appropriate for wells that are expected to flow at high drawdowns, or for wells with high deliverability potential. Values approaching 1 are most appropriate for aging wells, or for low deliverability wells.
Note: The n value cannot be less than 0.5, or greater than 1.0. Input values less than 0.5 are automatically set to 0.5, and values greater than 1.0 are automatically set to 1.0.
Forchheimer deliverability
Forchheimer deliverability (also known as the Laminar-Inertial-Turbulent or LIT equation) is another method to define a gas well's deliverability. The Forchheimer equation is stated as:
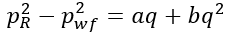
or
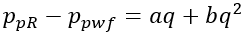
where:
aq = pressure drop due to laminar flow and wellbore effects
bq = pressure drop due to inertial-turbulent flow effects
pR = reservoir pressure
pwf = sandface flowing pressure
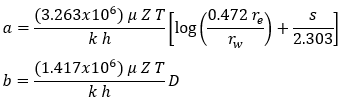
In general, values for “a” and “b” are determined from a well test (for example, isochronal test). If no well test is available, then the equations can be re-written in terms of reservoir parameters.
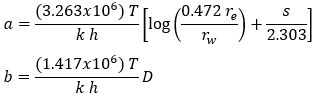
“a” and “b” values rewritten in terms of reservoir parameters
Pressure-squared method (in US Oilfield units):
Pseudo-pressure method (in US Oilfield units):