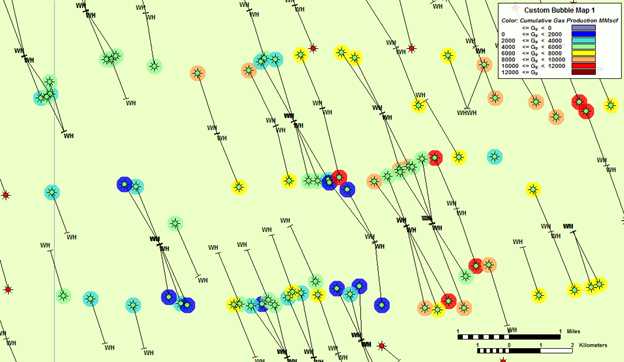
Bubble maps provide a means of graphically representing attributes and analyses associated with specific wells.
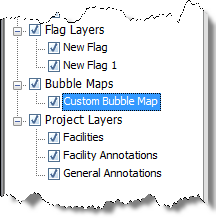
Bubble maps are represented as layers within the GIS tab, and can be selectively enabled or disabled like other layers. To create these graphic representations, a colored shape is overlaid on the entity. Both the color and the shape reflect one of the properties associated with the entity. As the value of the property changes, the color changes within a set range. In more complicated cases, multiple properties can be associated with different settings including variations in color, size, angle, and shape, according to the scale you set.
To show or hide the bubble map, select or deselect it in the tree structure.
To create a bubble map, start by selecting wells for the bubble map. In the GIS Configuration pane, click the + icon and select Add Bubble Map Layer.

Type a name for your bubble map layer and click Next. If you create a bubble map with the same name, a number is incrementally added to the name (for example, custom bubble map 1, custom bubble map 2, and so on).
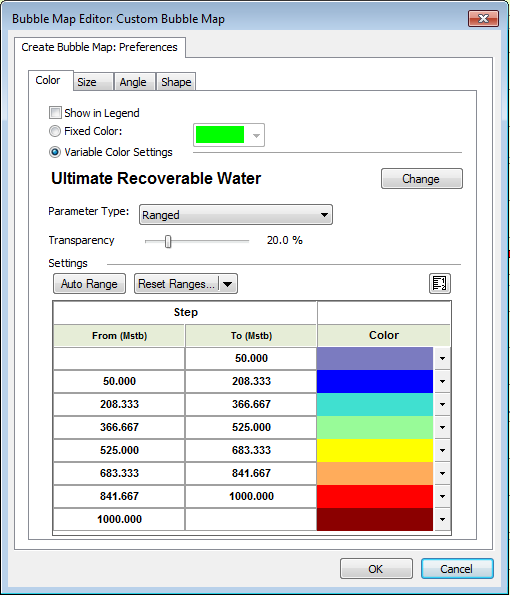
Each tab in Preferences enables you to customize a different property that varies with well properties. (Fixed settings are used by default.)
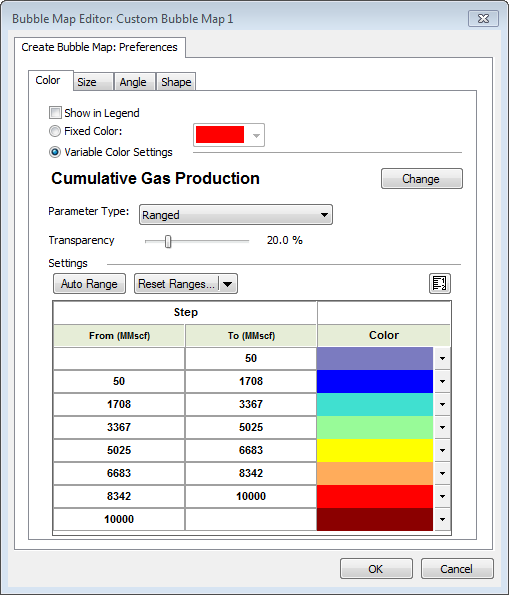
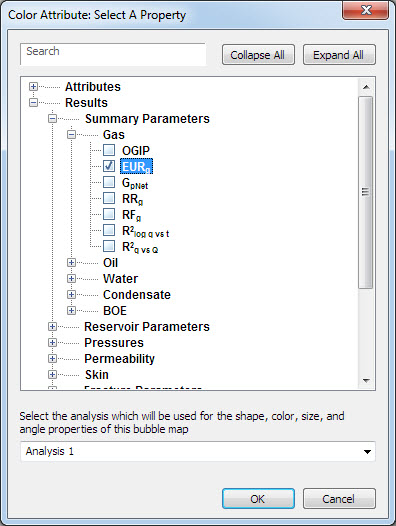
To edit an existing bubble map, right-click it in the tree structure and select Options. If you click Variable Color Settings, the Change button is enabled and you can set the <color> for a specific attribute.
To add wells to an existing bubble map, select the well, right-click it and select Bubble Map, Add to <bubble map name>.
IHS Harmony™ 2016b Multi-User | Last revised: October 19, 2016
Copyright © 2016 IHS Inc.