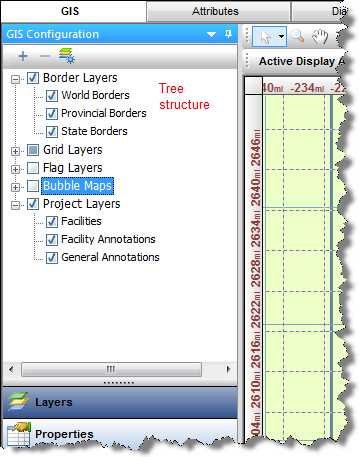
Layers
Layers are graphical strata that you can display on top of the GIS map. Layers include gridlines, geopolitical borders, and well icons. You can show and hide layers by selecting or deselecting items in the tree structure.
Layers include the following:
- Border Layers — displays the political borders for all countries, the provincial borders in Canada, and the state borders in the United States.
- Grid Layers — displays each of the available coordinate systems. The DLS and NTS coordinate systems are only available within certain regions.
- Shapefile Layer — a shapefile is a collection of files that contains simplified geo-spatial and attribute information to describe points, arcs, and polygons. These points and shapes represent objects or locations on a map (for example, a well, a lake, or political borders).
- Image Layer — any image (for example, a photograph) can be imported as an image layer. While importing an image file you are prompted to set desired coordinates for three points on the image. These points are used to position the image on the GIS map.
- Project Layers — includes all wells / facilities and annotations.
- Facilities — this layer includes all wells and meter stations.
- Facility Annotations — annotations connected to a specific entity (such as, wells) that display selected attribute and analysis information. For more information, see the Facility Annotation Editor dialog box.
- General Annotation — annotations to be displayed on the GIS map. While adding a general annotation, you can customize the text, appearance, and position.
- Bubble Map Layer — bubble maps graphically represent attributes associated with wells and other entities. For more information, see bubble maps.
- Flag Layer — flags are similar to bubble maps, but they do not reflect well attributes. Instead, they are simple markers that can be used to designate individual or multiple entities. For more information, see flags.
By default, layers are displayed with Project Layers being drawn on top of the GIS map, followed by Grid Layers, and Border Layers. This corresponds to Project Layers being at the bottom of the tree structure and Border Layers being at the top.
To change your display order, drag the category in the tree to your new location.
Note: Drawing layers on top of others may hide certain information. You can avoid this by setting the transparency of the top layer by right-clicking it in the tree and editing its properties.
IHS Harmony™ 2016b Multi-User | Last revised: October 19, 2016
Copyright © 2016 IHS Inc.