PITA Analysis
Subtopics:
Introduction
Conventional well testing has served the industry faithfully for decades as the primary and most reliable means of:
- Quantifying deliverability
- Characterizing a reservoir
- Evaluating the condition of a well
Conventional well tests are performed by producing reservoir fluid either into a gathering system, or by venting / flaring to the atmosphere. The production period, which can be a few minutes to several days or even years, is usually followed by a buildup period. Typically, the analysis is focused on the pressure buildup data, which requires the input of the production history prior to the buildup test.
An alternative to the conventional test is one that simply allows the well to flow into the closed wellbore after perforating (closed chamber test), which results in a pressure buildup. The pressure buildup data is collected for a period of hours or days, depending on the reservoir’s flow potential. These tests have been variously referenced to as: slug test, surge test, perforation inflow diagnostic (PID), or closed chamber test (CCT). Following a critical review of the literature published on these unconventional tests, we have developed a complete and systematic analysis that yields an estimate of initial reservoir pressure (pi), permeability (k), and skin (s'). We have called this procedure perforation inflow test analysis (PITA).
The following subsections illustrate the basis and the process of how PITA works, for a gas well perforated in an under-balanced condition (initial cushion pressure (pwo) < initial reservoir pressure (pi)). In this case, the formation fluid enters the wellbore (inflow). However, the same methodology applies to a perforation test done in an over-balanced condition, where initial cushion pressure (pwo) > initial reservoir pressure (pi). In such a case, wellbore fluid is actually injected into the reservoir during the test. The objective of PITA is to extract key reservoir parameters (initial reservoir pressure (pi), permeability (k), and skin (s')) from the pressure data.
Theory
The fundamental equations in Laplace space have been used to derive early time and late time solutions of the transient pressure behavior. Early time data is used to estimate skin (s'), and late time data is used to estimate initial pressure (pi) and permeability (k).
In gas wells, the pressure is usually measured at the wellhead and converted to sandface. This conversion is primarily due to hydrostatic head because the influx rate into the wellbore diminishes rapidly (and friction is negligible). The influx flow rate is not measured but can be estimated using closed chamber calculations, provided the assumption of single-phase flow can be justified. The figure below shows the typical profiles of measured pressure and the calculated gas influx rate for a perforation test of a gas well. As shown here, the influx rate declines rapidly.
PITA Test Data (Figure 1)
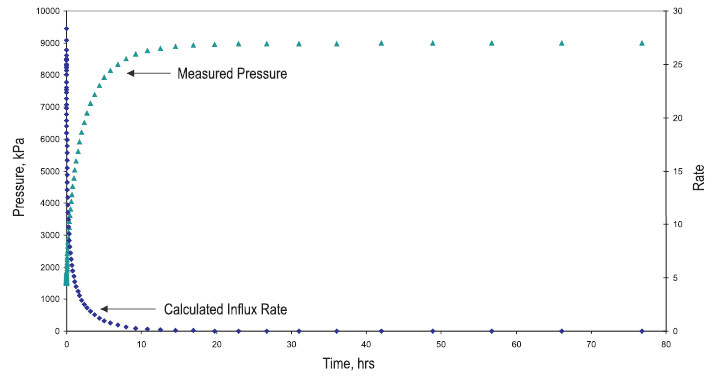
If a reservoir is expected to produce liquid, the pressure must be measured downhole (near the perforations). For oil reservoirs, wet coals or aquifers that have little or no associated gas production at the time of perforating, single-phase flow can be assumed, and the influx flow rate can be estimated using closed chamber calculations.
Flow Regimes
It is obvious that the data for PITA is significantly influenced by wellbore storage. It is also evident that the data is directly influenced by the flow capacity (kh) and skin (s'). The critical part of any analysis is distinguishing between the data that is dominated by wellbore storage, and the data that is dominated by the reservoir response (radial flow). Just as in traditional well testing, the best way to differentiate between these flow regimes is to plot the derivative. However, the derivative for PITA is different from the traditional derivative of well testing. The PITA derivative, also known as the impulse derivative, is defined as the product of time squared and the derivative of pressure with respect to time (also known as the Primary Pressure Derivative (PPD)) as follows:
![]()
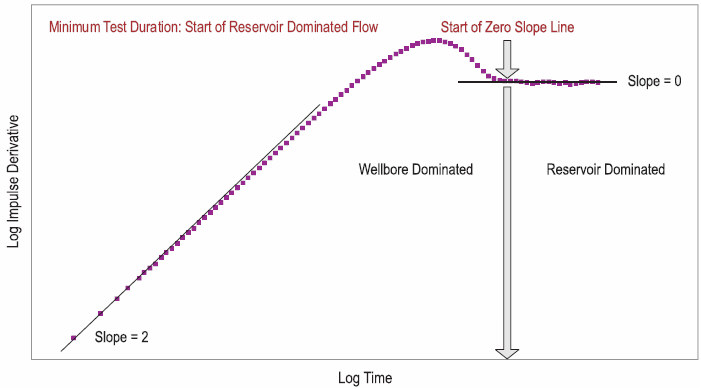
A typical derivative using the above equation is shown in Figure 2. It illustrates that the early time data (wellbore storage) has a slope of 2 for a positive skin (well test derivative has a slope of 1), and the late time data (reservoir flow) has a slope of 0 (flat line, same as the conventional well test derivative).
| Note: | For a zero or negative skin, the derivative will yield an initial slope of 1.75. |
Using this convention for the derivative, it is easy to recognize if reservoir flow exists. If it does, initial reservoir pressure (pi) and permeability (k) can be determined. At least some of the late time data should fall on the flat part of the derivative, as shown in Figure 2, to obtain a reliable analysis. If this data exists, then skin (s') can also be calculated from the early time data. If reservoir flow is not apparent, then a unique interpretation for these reservoir characteristics is not possible.
PITA Flow Regime Diagnostic (Figure 2)
If a formation is partially penetrated, and has low permeability (k), only the pay thickness exposed to the wellbore should be considered in the analysis. However, in some cases where perforation plugging restricts communication with the formation, using the total pay thickness can yield a low estimate of permeability (k).
| Note: | The fundamental equations were originally derived for liquid flow in terms of time and pressure. To apply these equations to gas flow, time and pressure are replaced with pseudo-time (ta) and pseudo-pressure (y) respectively. |
Analysis
In traditional well test interpretation, we start analyzing the data from early time to late time. In PITA, we start with the late time analysis first to obtain initial reservoir pressure (pi) and permeability (k). Then the early time data (where the derivative slope is 2 or 1.75) is analyzed and skin (s') is calculated using this analysis along with the permeability (k) obtained from the late time analysis.
A summary of the procedure for analyzing a perforation inflow test for a gas well is presented below:
1. Convert measured wellhead pressure to sandface pressure (if necessary).
2. Convert sandface pressure to pseudo-pressure.
3. Convert time to pseudo-time.
4. Calculate the impulse derivative and plot versus pseudo-time on a log-log scale (see Figure 2).
5. Determine the start of late time reservoir dominated flow (Figure 2).
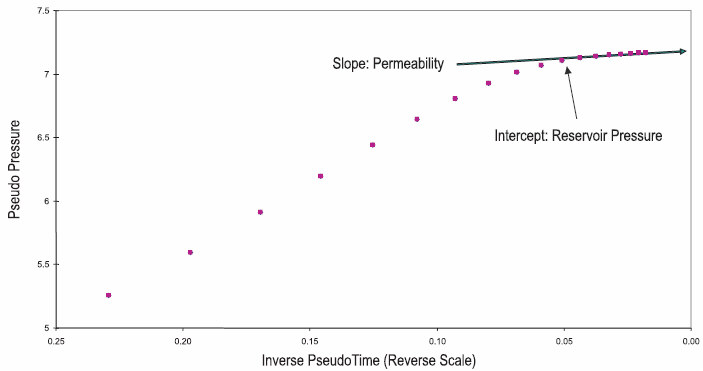
6. Analyze the late time data by plotting pseudo-pressure (y) versus inverse pseudo-time (1 / Dta) on reverse Cartesian coordinates (see Figure 3). A straight line through the valid late time data gives permeability (k) (from slope (m)) and initial reservoir pseudo-pressure (yi) (from intercept) using the following equation:
7. Convertyi to pi, to get the initial reservoir pressure (pi).
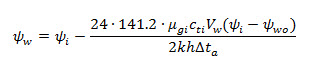
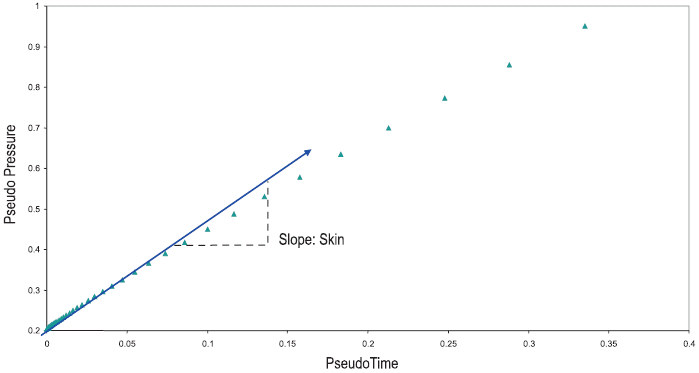
8. Analyze the early time data by plotting pseudo-pressure versus pseudo-time on Cartesian coordinates (see Figure 4). Based on the early time slope on the derivative (Figure 2), use the appropriate equation below along with a yw and Dta read from a point on the early time analysis line to calculate skin (s') (Figure 4).
For a derivative slope of 2 (positive skin (s' > 0)):
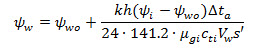
For a derivative slope of 1.75 (0 or negative skin (s <= 0)):

In terms of the slope, of the "early time negative skin" analysis line on the Early Time plot.
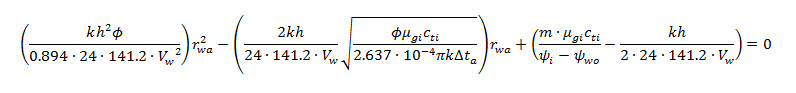
After rwa is calculated, the skin (s') is found from the following equation:

Note that when rwa = rw, s' = 0, and when rwa > rw, s' < 0.
PITA Late Time Analysis (Figure 3)
Early Time Analysis (Figure 4)
After the key reservoir parameters (initial reservoir pressure (pi), permeability (k), and skin (s')) are estimated from PITA, a PITA model is used to confirm the estimated parameters. This is especially critical when reservoir dominated (radial) flow is not achieved within a test period, or when data scatter aggravates the analysis.
Experience shows that it can be difficult to differentiate between a small positive skin (s') and a zero or negative skin (s'), based on the early time analysis alone. Under such circumstances, the PITA model provides a more reliable indication of the skin (s') value, if reservoir dominated flow is achieved, or at least, if a transition to reservoir dominated flow is developed.
References
1. "Use of PITA for Estimating Key Reservoir Parameters", N.M. Anisur Rahman, Mehran Pooladi-Darvish, Martin S. Santo and Louis Mattar, Paper CIPC 2006 - 172 presented at 2006 Canadian International Petroleum Conference, Calgary, Alberta, Canada, June 13 - 15.
2. "Development of Equations and Procedure for Perforation Inflow Test Analysis (PITA)", N.M. Anisur Rahman, Mehran Pooladi-Darvish and Louis Mattar, Paper SPE 95510 presented at 2005 ATCE, Dallas, TX, October 9 - 12.
3. "Perforation Inflow Test Analysis (PITA)", N.M. Anisur Rahman, Mehran Pooladi-Darvish and Louis Mattar, Paper CIPC 2005 - 031 presented at 2005 Canadian International Petroleum Conference, Calgary, Alberta, Canada, June 7 - 9.