Identifying Minimum dp/dG
Related Topic:
Compliance Method Pre-closure Analysis
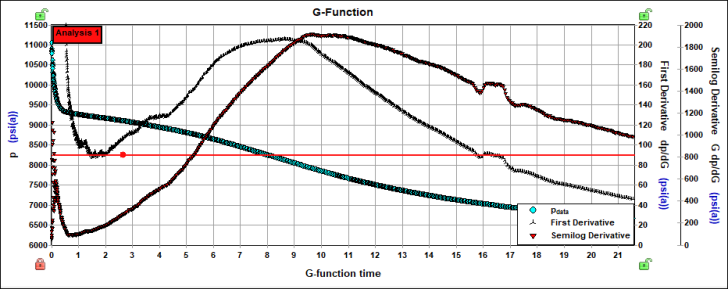
Minimum dp/dG is identified on the G-function plot in a pre-closure analysis (Compliance Method).
1. On the G-Function plot, the Minimum dp/dG line can be used to identify the region of low dp/dG by clicking the line and dragging it. Min. dp/dG line is provided to facilitate in identifying the region of low dp/dG, which certainly comes in handy for difficult cases of monotonic decreasing dp/dG. However, this is an optional step.
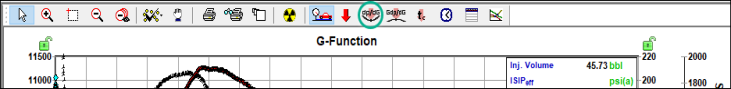
2. Click the dp/dG arrow icon on the G-Function plot toolbar.
3. Click the G-Function plot where the First Derivative data is lowest to add the Min. dp/dG arrow annotation. Once the arrow annotation is added the Minimum dp/dG line is attached to it.
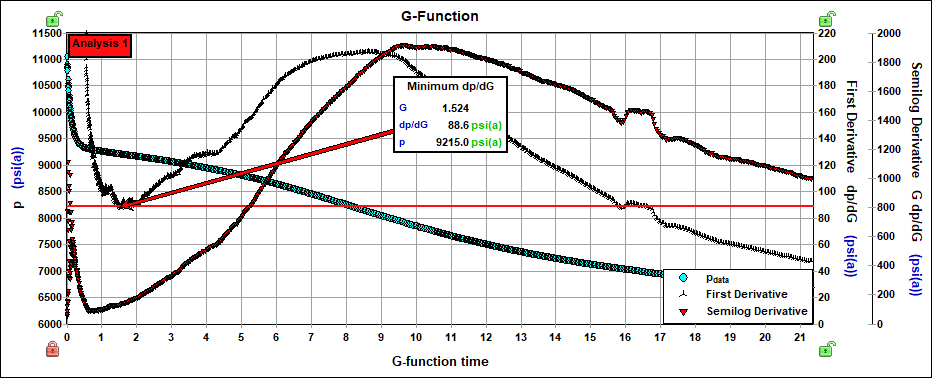
4. Click the Min. dp/dG arrow and use the left and right arrow keys to fine-tune your selection.