Open topic with navigation
Changing color palettes
Specify color fills for logs and traces in seismic, logs, cross plots, models, and more. Color schemes can be loaded from stock color palettes that
ship with GeoSyn, or from color templates you save in the GeoSyn Working directory with a .pal
extension. Templates can be quickly applied to any synthetic and can be
shared amongst GeoSyn users.
Color schemes can also be configured for the current
synthetic without creating a template and automatically saved with
individual GeoSyn files.
To automatically apply a color scheme to all new synthetics,
apply it to the current synthetic then update the import defaults file
with the current synthetic options.
When working with models and certain types of crossplots, you can drag the min max color nodes that appear at the top and bottom of the histogram to tighten them to the desired amplitude range so that a fuller color spectrum is displayed in GeoSyn. This option isn't available for cross plot properties with a depth-based color reference type, or for logs, as typically a certain color represents a certain log value and is related to lithology.
To change color palettes:
- Open the Edit color palette:
- Well Properties:
Log Properties, select Edit adjacent to the Infill display (
 ).
). - Model
Properties dialog box, select Edit adjacent to the color display ().
- Seismic
Properties dialog box, select Edit adjacent to the Color underlay display ().
The
dialog box opens. The top and bottom of the color bar represent the
fixed extremes in the data values of the selected log or trace. Nodes
along the display bar associate a color to a particular data value.
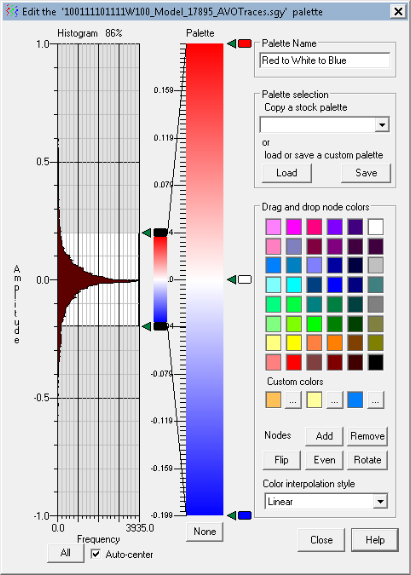
- Choose a palette:
- Copy
a stock palette drop-down list
- Load import a previously saved custom palette .
- Noneremove all colors
To create a custom color palette:
- Creating a custom color bar can be done in several ways:
- Drag and drop color on existing node.
- Drag and drop color on the color bar. GeoSyn creates a corresponding node for each
color you drop.
- Create a custom color
- Type
a unique name for this color configuration in the Palette
Name box then click Save
to save it in the GeoSyn Working
directory.
Related topics
Changing seismic properties
Changing log display properties
Creating models
Changing import defaults
Creating crossplots
Open topic with navigation