Data Viewer Tasks
Viewing Individual Well Data
When well data is displayed in the Data Viewer, it is centralized on the diagnostic plot. This means that the scale of the data displayed can be different for each well, making it difficult to compare the data from multiple wells accurately.
To view the individual production of multiple wells on the same axis:
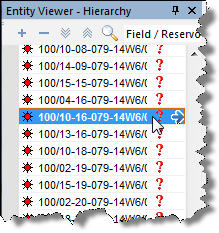
1. Highlight the wells you want to compare.
2. Click the Plot aggregate or individual entity production icon (![]() ).
).
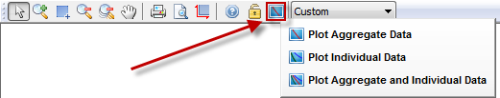
3. Select either the Plot Individual Data, or the Plot Aggregate and Individual Data menu option.

The individual production of the selected entities will be shown on the plot for all plotted datasets. If you mouse over an entity, that well’s production will become thicker on the plot to help distinguish it from the other selections.
Note: Customizing a dataset will apply its settings to all selected wells. If multiple entities are selected, all individual static pressures at datum depth are corrected to the group’s averaged datum.
Exporting Historical Production Data
The datasets you select in the hierarchy or custom entity viewer can be exported using the batch export tool. A Batch Export icon is located in the Data Viewer Properties toolbar and is enabled when one or multiple wells are selected, and the icon is also enabled if groups are selected along with your well(s) selection. Note that aggregate data cannot be exported using this feature; therefore, this icon is disabled when one or multiple groups are selected.
To export historical production data for selected wells:
1. Select your wells from the Entity Viewer and click the Diagnostics tab.
2. Click the Batch Export icon.
The Batch Export dialog box opens.
3. Select the datasets you would like to export in the tree. By default, the datasets selected in the Data Viewer Properties pane will be selected in the Batch Export tree.
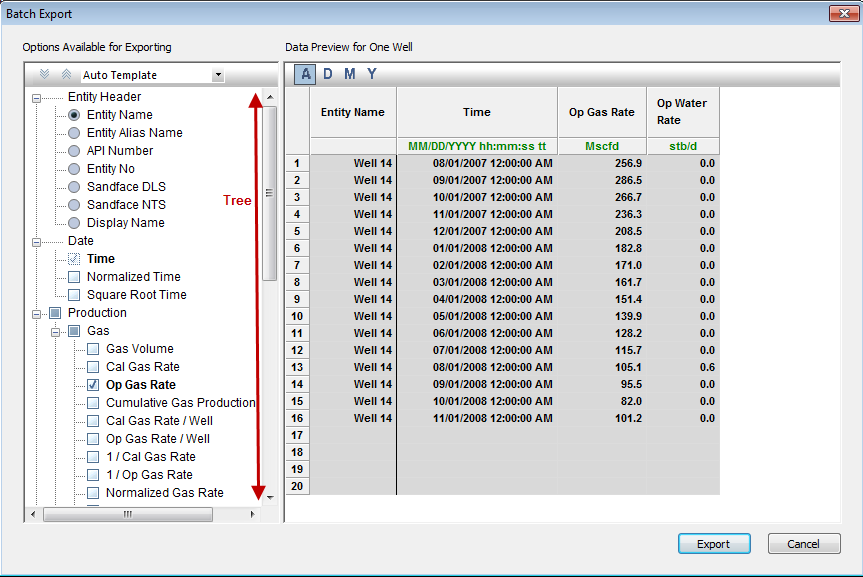
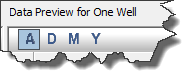
4. Apply the sampling rate that you would like to export the data in. Click the D, M,and Y icons to re-sample the data to be daily, monthly, and yearly data, respectively. Click the A (actual) icon, to maintain the original sampling rate of the data.
5. Set your column order for the export file by dragging and dropping the columns within the Data Preview table.
Note: The Entity Name and Time columns are reserved for the first two columns.
6. Click the Export button.
A .csv file is saved to the location you choose.
Export templates can be saved by clicking the drop-down list in the toolbar and selecting Save/Delete Template. From the Save Template dialog box, you can create new templates and delete old templates.
Using Templates
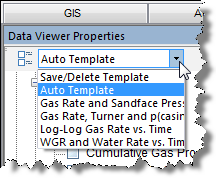
When an entity is selected in the Entity Viewer, it is displayed by default using the Auto Template plot. This plot consists of parameters that are relevant to the selected entity. (For example, when a pumping oil well is selected, the Auto Template plot displays oil, gas, and water production rates vs. time, but when a water injection well is selected, the Auto Template plot displays the water injection rate with oil and gas production rates vs. time.)
In addition to the Auto Template, Harmony offers four other default plot templates:
1. Gas Rate and Sandface Pressure vs. Time
2. Gas Rate, Turner Rate, and Casing Minus Tubing Pressure vs. Time
3. Log- Gas Rate vs. Time
4. WGR![]() and Water Rate vs. Time
and Water Rate vs. Time
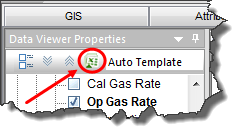
To display the list of available plot templates, click the drop-down menu in the Data Viewer Properties pane.
Note: Templates are computer-specific, not project-specific. Any template modifications you make in one project will be reflected in all subsequent projects that you open.
Creating a Custom Plot Template
You can create a customized plot and save it in the list of templates. In order to do this, you must modify an existing template to include your desired plot parameters, which automatically changes the template from default to custom.
To create a custom plot template:
1. Select an entity in the Entity Viewer.
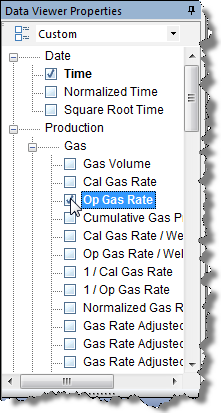
2. Select or deselect the checkboxes next to the parameters in the Data Viewer Properties pane. Or, you can drag-and-drop parameters from the tree structure onto the plot. As soon as you modify the default plot, its name changes to Custom.
Click the Deselect
All Series icon (![]() ) to deselect
all of the checkboxes simultaneously.
) to deselect
all of the checkboxes simultaneously.
3. Click the Template drop-down menu and select Save/Delete Template.
The Save Template dialog box opens.
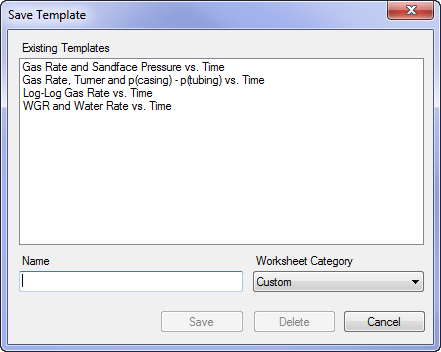
4. Specify a name and worksheet category for the new template; then click Save.
From the Worksheet Category drop-down list, you can specify an analysis method under which your new template will be saved.
Note: The headers, axes, and datasets of plots can be modified in multiple ways. To display plots for further analysis, click the Results tab.
Deleting a Custom Plot Template
To delete a template:
1. Click the Template drop-down menu and select Save/Delete Template.
The Save Template dialog box opens.
2. Highlight the template that you wish to remove; then click Delete. The template is removed.
3. Click Cancel to close the dialog box. (This also saves your changes.)