Creating a Pressure Gradient Analysis
To create a pressure gradient analysis:
1. Launch an entity for analysis.
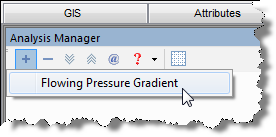
2. Click the Pressure Gradient thumbnail.

3. Add the Flowing Pressure Gradient analysis to the worksheet. See Adding an Analysis for details.
4. Select an existing wellbore and configuration in the Analysis Parameters pane.
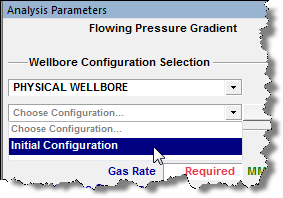
5. Select the types of fluid that are flowing in the well, and then enter the rates.

Note: By default, the
Use Gas option is enabled.
To select other fluid types for consideration, click the box next to the
desired fluid. (Condensate and Oil cannot be selected at the same time.)
If gas and liquid are both present, then a liquid-gas ratio (
OGR![]() or WGR
or WGR![]() )
is also required.
)
is also required.
6. Enter a value in either the Wellhead Pressure field or Sandface Pressure field.
Note: When one pressure value is entered, the other is automatically calculated.
Once the pressure has been calculated, the gradient(s) is plotted.

- Unloading Velocity – displays a virtual critical liquid lift (or liquid loading) velocity gradient for the well that is displayed on the plot along with the actual velocity gradient. If the actual velocity is less than the critical velocity at any point, the difference is displayed as a shaded area (indicates a possible liquid loading problem).
- Erosional Velocity – displays a virtual erosion velocity gradient for the well that is displayed along the actual velocity gradient. If the actual velocity is greater than the erosion velocity at any point, the difference is displayed as a shaded area (indicates a possible erosion problem).
- Hydrates Envelope – displays a virtual hydrate envelope for the well that is displayed along the actual temperature gradient. If the actual temperature is less than the hydrate envelope temperature at any point, the difference is displayed as a shaded area (indicates a possible hydrate problem). The actual pressure gradient is displayed using dots to show the depth to which hydrates are expected.