Data Diagnostics (Pressure Gradient Analysis)
With the Data Diagnostics tool, you can view calculations for each segment in the wellbore, and plot most of these parameters against measured depth.
Note: If you have trouble opening the Data Diagnostics tool, review the messages in the Status Window.
To use this tool:
1. After creating your pressure gradient analysis, click the Details button in the Analysis Parameters pane to open the Data Diagnostics tool.
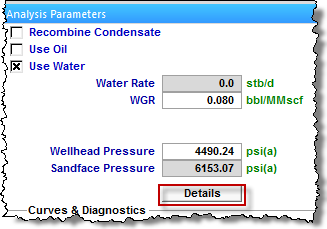
This will display all the parameters used by the software to calculate the sandface pressure.
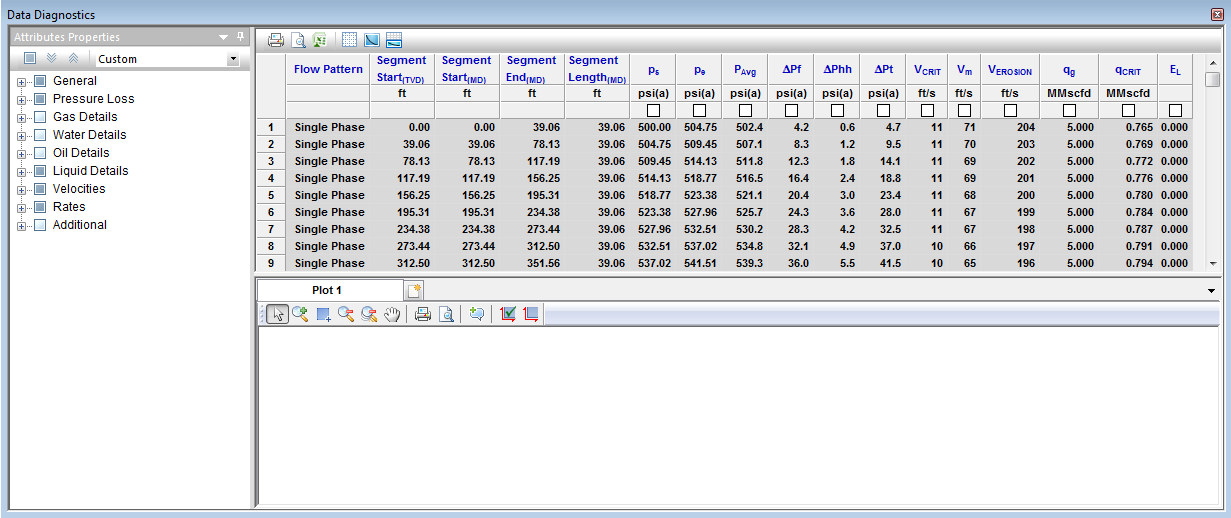
2. Use the Attributes Properties pane to select / deselect the parameters you want to display.
3. To plot a parameter, click inside the box at the top of the data column. Note that multiple parameters can be plotted at the same time for comparison.