History Matching (Single-layer PSS)
History matching can be performed using measured sandface flowing pressures, gas rates, water rates, or combinations thereof. This process is used for obtaining reservoir parameters.
Note: When performing a history match on production data that includes flowing pressures measured at the wellhead, you must enter wellbore data. The wellbore is used to convert these pressures to equivalent sandface pressure.
Performing a History Match
To perform a history match, you must enter production data, including rates and flowing pressures.
To perform a history match:
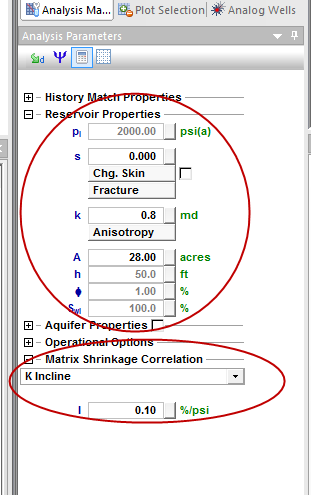
1. Enter reservoir properties.
2. Import / enter production history. (If production history includes flowing pressures measured at the wellhead, enter wellbore information.)
4. In the Analysis Parameters pane, expand the History Match Properties section.

5. Set the calculation mode for the history match by selecting one of the options (described below) from the Calculate drop-down menu.
- qg, qw using pwf : Uses the flowing pressure to calculate the gas and water rates.
- qg, qw using pwf, Gp: Uses the flowing pressure and the historical cumulative gas production to calculate the gas and water rates.
- qg, qw using pwf, Wp: Uses the flowing pressure and the historical cumulative water production to calculate the gas and water rates.
- qg, qw using pwf, Gp, Wp : Uses the flowing pressure and the historical cumulative gas and water production to calculate the gas and water rates.
- pwf, qw using qg: Uses the gas rate to calculate the flowing pressure and water rate.
- pwf, qw using qg, Wp: Uses the gas rate and historical cumulative water production to calculate the flowing pressure and water rate.
- pwf, qg using qw: Uses the water rate to calculate the flowing pressure and gas rate.
- pwf, qg using qw, Gp: Uses the water rate and historical cumulative gas production to calculate the flowing pressure and gas rate.
Note: Using historical cumulative production means that the material balance equation (which is used to calculate reservoir pressure at each time step) will use the actual cumulative production in the equation, instead of the calculated cumulative production.
We recommend that you only use this option to fine-tune your history match.
6. Adjust reservoir properties until you obtain a satisfactory match. See History Matching Strategies.
7. Create a forecast based on the history-matched reservoir model.
History Matching Strategies
Some history-matching strategies are as follows:
- Increasing permeability increases peak gas and water rates, thus increasing the decline rate.
- Increasing the drainage area lowers the peak gas rate, and shifts it later in time, decreasing the decline rate of both the gas and water.
- Using a negative skin increases peak gas and water production, increasing the decline rate.
- In wet coals, increasing porosity decreases the peak gas rate. This happens because the cleat space (porosity) is initially filled with water, and the water has to be produced before gas can start to desorb. With increased porosity, there is an increased volume of water, which decreases gas production.
- An undersaturated coal delays gas production because water has to be produced until the pressure drops to the desorption pressure.
- If the initial water saturation is below 100%, there will be free gas, resulting in gas rates peaking sooner, as well as less water production.
History Matching Using Gas Permeability
Harmony includes a feature that can aide history matching, in particular for reservoirs that display matrix shrinkage. This feature calculates gas permeability from production data, as well as from the PSS model, and plots these values versus average reservoir pressure. A satisfactory history match will result in the permeability from production following the permeability calculated from the model. For more information on the theory behind this technique, see History Matching Using Gas Permeability (for CBM).
To perform a history match on gas permeability:
1. Enter reservoir properties.
2. Import or enter production history. See Production Editor for additional information.
If production history includes flowing pressures measured at the wellhead, enter wellbore information. See Entering Wellbore Data for additional information.
3. Create a PSS worksheet. See Creating a PSS Forecast (steps 1-5) for additional information.
4. In the Forecast Parameters pane, click the kg vs P tab.
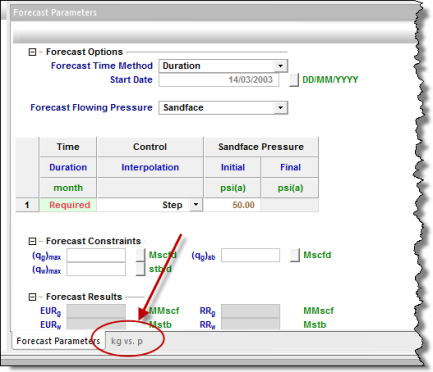
Note: The kg vs P plot can be repositioned by clicking the kg vs P tab, and then holding the right-click button on the mouse, while you drag the window to a new position. For additional information, see the History Match Gas Permeability vs Pressure Using the Kg vs P Plot video (opens in a new window, mp4 file).
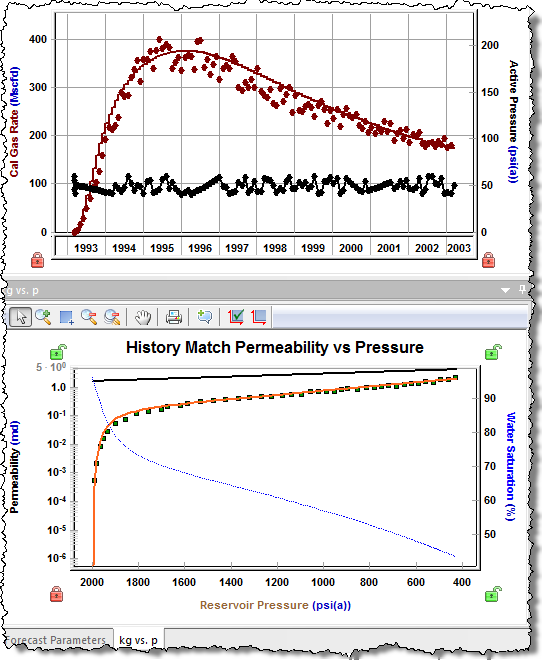
The kg vs P plot is displayed, which shows gas permeability calculated production (i.e., actual gas permeability), gas permeability calculated from the model (i.e., synthetic gas permeability), water saturation, and absolute permeability.
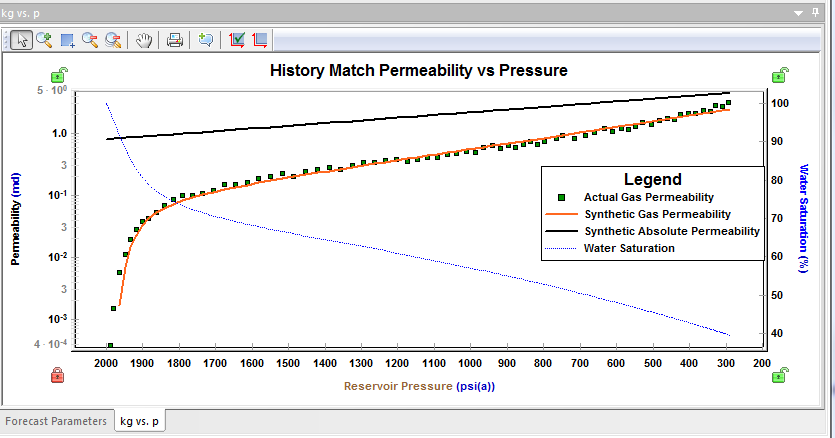
5. If the Actual Gas Permeability points do not follow the Synthetic Gas Permeability curve, modify the input variables to the model in the Analysis Parameters pane.
A satisfactory match should result in both the Gas Rate vs Time data, and Gas Permeability vs Pressure data matching the calculated model — both of which can be displayed simultaneously.