PSS Forecast Parameters
The Forecast Parameters pane is where the majority of the forecast controls are located, and has three sections:
1. Forecast Options
2. Forecast Constraints
3. Forecast Results
Note: Each of these sections can be expanded or collapsed by clicking the +/- box.
Forecast Options
The Forecast Options section is where forecast periods are defined according to either durations (e.g., months), or dates.
- Setting the forecast time method to Duration begins a forecast at a specified start date. Forecast periods are then defined in the forecast table according to a length of time (the default is months). For each forecast period, different operating conditions can be specified.
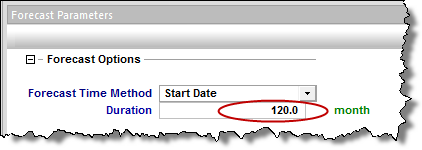
- Setting the forecast time method to Start Date creates a forecast of a specified length of time (the default is months). Forecast periods are then defined in the forecast table according to calendar dates.
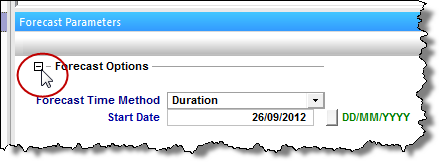
If you select Duration from the Forecast Time Method drop-down menu, the Start Date is automatically populated. (You can change this date later, if needed.)

If you select Start Date from the Forecast Time Method drop-down menu, enter a value for Duration (i.e., the total length of the forecast).
Enter further details for each forecast period in the forecast table.
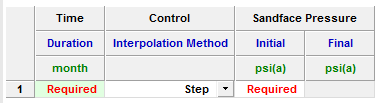
An additional forecast period can be entered each time an operational change occurs (e.g., the flowing pressure decreases when a compressor is added). The forecast table has the following sections:
- Time: defines the length of each forecast period. If the forecast time method is set to Duration, the Time column will show duration. The forecast will run for the length of time entered in the Duration column at the specified operating conditions. If the forecast time method is set to Start Date, the Time column will show the start date. The specified operational conditions will begin at the start date entered in the table.
- Control: defines how the operating conditions will change over the forecast period. Currently, the only operating condition that can be set for the PSS forecast is flowing pressure. The interpolation of the control can be set to either Step or Ramp. "Step" will define a constant flowing pressure over the forecast period. "Ramp" will vary the flowing pressure linearly over the forecast period from an initial value to a final value.
- Sandface Pressure: defines the flowing sandface pressure during the forecast. If Control -> Interpolation is set to Step, only the initial flowing pressure must be specified. If Control -> Interpolation is set to Ramp, an initial and final flowing pressure must be specified for the forecast period.
As soon as a value is entered in the forecast table, an additional row opens where the next forecast period can be defined. Additional rows can also be added or deleted by right-clicking the row, and selecting Insert / Delete row. Only one row needs to be filled out in order to run a forecast.
Forecast Flowing Pressure
Forecasts can be calculated by defining either a flowing sandface or flowing wellhead pressure. To set the forecast flowing pressure, under Forecast Options, click the Forecast Flowing Pressure drop-down menu and select either sandface or wellhead:
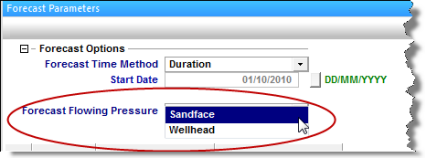
- If Forecast Flowing Pressure is set to Sandface, the pressures entered in the forecast table (see Step 6 of Creating a PSS Forecast) will be used directly as the bottomhole flowing pressure to calculate the forecast.
- If Forecast Flowing Pressure is set to Wellhead, the pressure entered in the forecast table will be converted to a bottomhole flowing pressure using the information entered in the Wellbore Editor.
Note: In order to perform a forecast using wellhead pressures, a valid wellbore must be entered.
When Forecast Flowing Pressure is set to Wellhead, and the flow path in the Wellbore Editor is set to pumping, two additional columns are displayed: Liquid Level and Average Liquid Gradient.
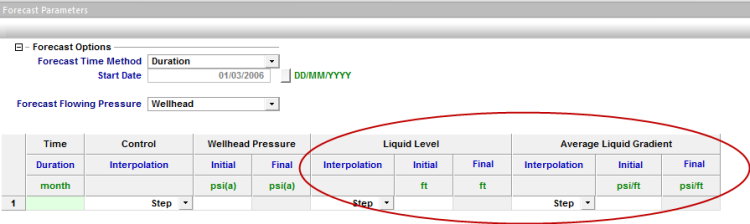
- In the Liquid Level column, you can set a changing liquid level over time: either a constant value (Interpolation = Step), or varying linearly over the forecast period (Interpolation = Ramp).
- In the Average Liquid Gradient column, you can set a changing liquid gradient over time: either a constant value (Interpolation = Step), or varying linearly over the forecast period (Interpolation = Ramp).
For more information on pumping wells, see Artificial Lift - Pumping wells.
Forecast Constraints
The Forecast Constraints section is where maximum rate conditions and abandonment rate conditions can be entered, such as the following:
- (qg)max: Sets a maximum gas rate during the forecast. In order to maintain the maximum gas rate constraint, flowing pressure is adjusted.
- (qw)max: Sets a maximum water rate during the forecast. In order to maintain the maximum water rate constraint, flowing pressure is adjusted.
- (qg)ab: Sets the abandonment gas rate for the forecast. When the abandonment rate is reached, the forecast will end.
Forecast Results
The Forecast Results section is where the results of the forecast are summarized, and is composed of the following values:
- EURg / EURw: Expected ultimate recovery (EUR) of the gas and water phases.
Note: For wells with actual historical data, EUR is defined as the cumulative of the historical data up to the beginning of the forecast, after which time, the synthetic cumulative calculated from the model will be used until the end of the forecast.
- RRg/RRw: Remaining recoverable (RR) of the gas/water phases.
- (qg)peak: The peak gas rate.
- tpeak: The date at which the peak gas rate occurs.