Accounting for Changing Oil Saturation in the Oil URM
During oil production, flowing pressure often drops below the oil bubble point pressure, and therefore, some free gas appears in the reservoir. The oil unconventional reservoir model (URM) analysis enables you to account for such behaviour. For information on these calculations, see Accounting for Changing Oil Saturation in Oil URM (theory).
To account for changing oil saturation in the oil URM:
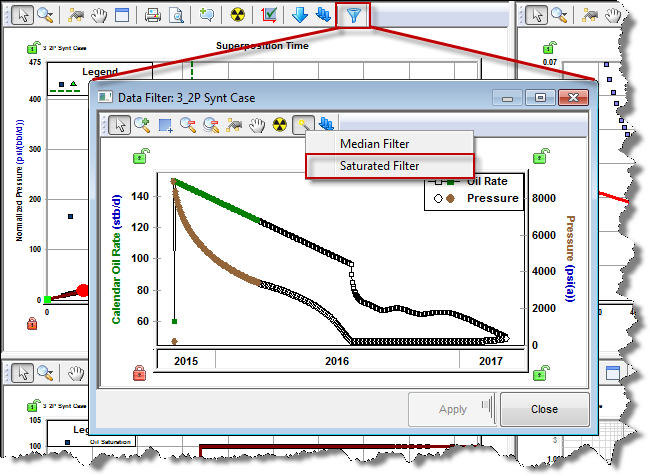
1. Identify a portion of the data where flowing pressure is below the oil bubble point (oil and gas are flowing in the reservoir), by using the Saturated Filter.
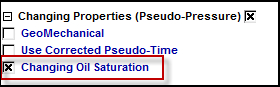
2. Select and expand the Changing Properties (Pseudo-Pressure) option.
3. Select the Changing Oil Saturation option under Changing Properties (Pseudo-Pressure). Note that this option is only available if the flowing pressures are below the oil bubble point pressure for a portion of the production data.
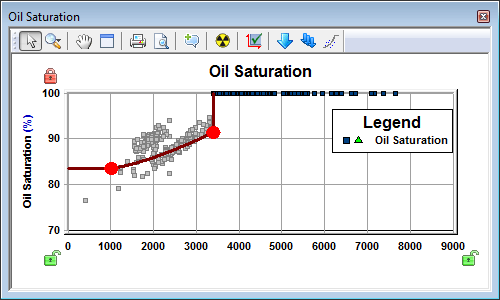
The Oil Saturation plot appears. Points on the plot represent oil saturations that are estimated based on production data, and the brown line is an approximation for those points.
4. If required, adjust the line so that it describes the data points as closely as possible. You can move the red dots and drag the segment between them.
Calculations used to generate square root time and FMB plots are now adjusted to account for relative permeability effects.
Note: When the Changing Oil Saturation option is selected, the calculation uses gas-oil relative permeability curves set in the Properties Editor; therefore it is important to have an accurate input.
Saturated Filter
The URM analysis is a single-phase analysis; therefore you should be cautious when applying it to cases where a well exhibits two-phase flow. For oil wells, we can expect two-phase flow after the flowing pressure drops below the oil bubble point pressure. The Saturated Filter option can be used to identify the portion of the data where flowing pressure is below the bubble point pressure (oil and gas flowing in the reservoir).
To use the Saturated Filter option:
Click the Data Filter icon on square root time or an FMB plot, then click the Fully Automatic icon on the Data Filter plot.
Note: The Saturated Filter uses the oil bubble point pressure set in the Properties Editor; therefore it is important to set it accurately.
Oil Saturation Plot
The Oil Saturation plot is available when the Changing Oil Saturation option is used.
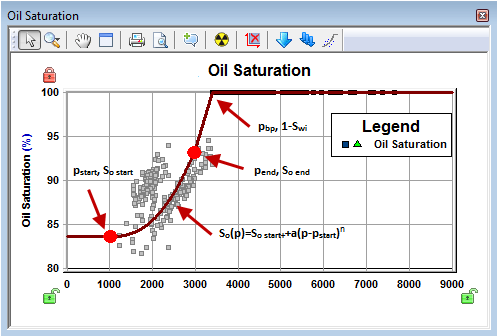
Points on the plot represent Oil Saturation vs. Flowing Pressure, and are estimated based on production data. The calculations used to generate these points are described in Accounting for Changing Oil Saturation in Oil URM (theory).
The line on the plot represents So(p) - the relationship between oil saturation and pressure. This relationship is used in two-phase oil pseudo-pressure and pseudo-time calculations.
You can manipulate the line to get it to describe the relationship between oil saturation and pressure, which is estimated based on production data (points). To do this, you can move the red points on the plot, or drag the segment between these points to change its curvature.
Alternatively, you can change the curve by manually changing its parameters. (This may be useful if you want to use exactly the same curve for a different analysis, or even for different wells.) To access parameters describing the So(p) curve, click the Saturation Curve Parameters icon (![]() ) on the Oil Saturation plot.
) on the Oil Saturation plot.
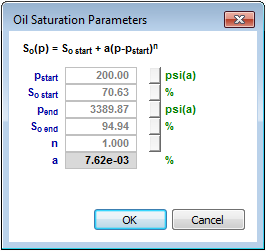
The saturation curve consists of these segments:
- Segment 1 (p<pstart): So(p)=So start
- Segment 2 (pstart≤p<pend): So(p)=So start+a(p-pstart)n
- Segment 3 (pend≤p<pbp): straight line connecting (pend, So end) and (ppb, 1- Swi)
- Segment 4 (p≥pbp): So(p)=1-Swi
Note: Similar to any other plot in URM, the Oil Saturation plot can be floated, or it can be displayed on the dashboard, using the Change View icons: ![]() .
.