Properties Editor
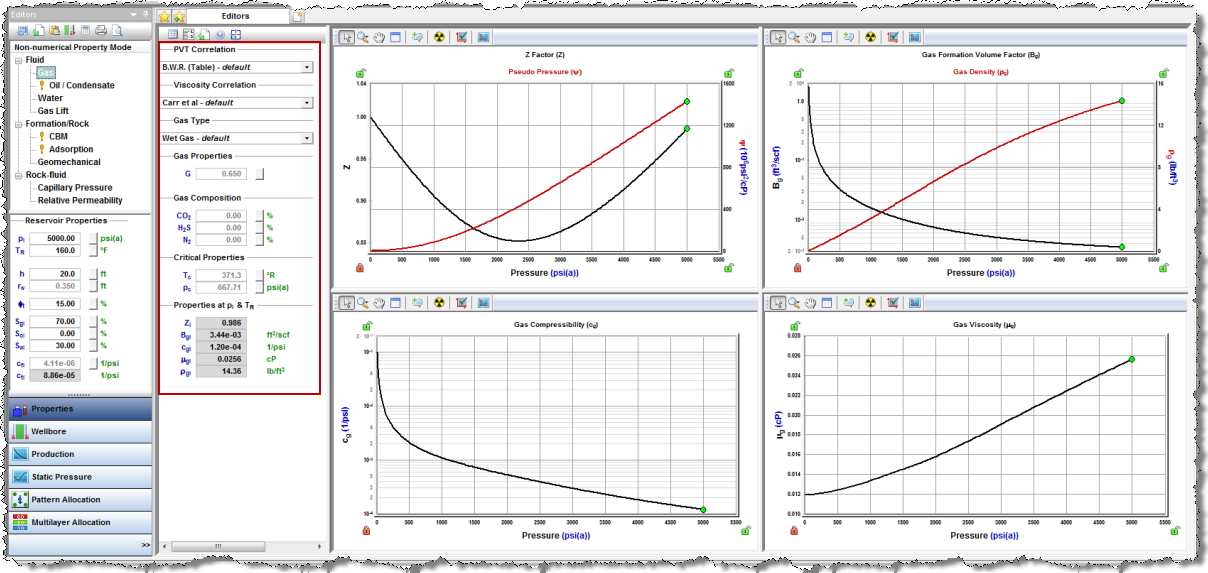
The Properties Editor (located within the Editors pane) is where correlations for fluid, formation / rock , and rock-fluid properties are set, and reservoir properties are entered. This data is used in reservoir and wellbore analyses. The Editors pane has a tree structure organizing different properties under three categories: fluid, formation / rock , and rock-fluid properties.
Note: You must enter properties to perform any of the IHS RTA, IHS CBM, or IHS VirtuWell analyses. In addition, you may need to enter properties for some of the IHS DeclinePlus analyses. For multilayer wells, see Multilayer Wells: Properties Editor Differences.
User Interface
The tree structure is on the top left with the Reservoir Properties pane below it. At the top of the Editors pane is a toolbar where you can change your plot options, import custom data, copy to / paste from the clipboard, calculate sandface pressures, and print.
From the Property Editor view of each property in the tree structure (e.g., gas, water, etc.), you can update inputs, and plots / data tables will be displayed to the right.
Secondary Toolbar
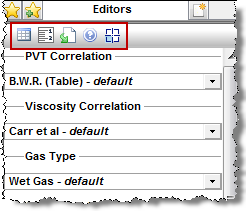
The secondary toolbar is to the right of the Editors pane's toolbar. From the toolbar, you can switch between View Data and View Plot, toggle units, import data, get help information for correlations, and select which plot to display.
Note: At the top of each plot there is a another standardized toolbar.
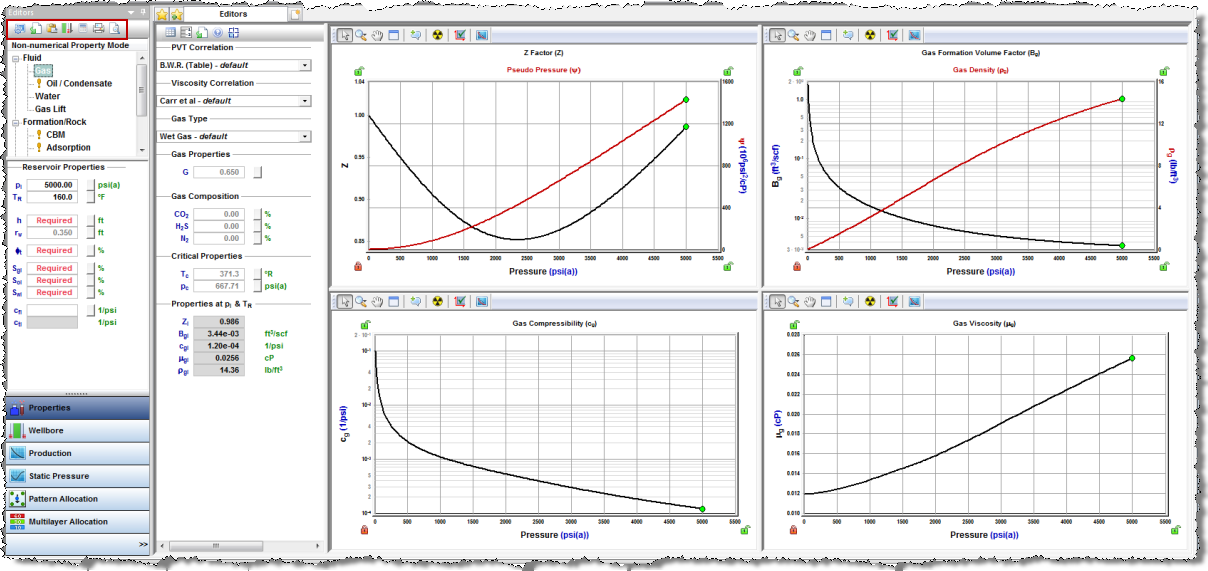
Gas Properties
After you select Gas in the selection tree, you can select a PVT correlation or custom table from the PVT Correlation drop-down list. (If you select Custom Table, you can enter your own data.)
Similarly, you can select a viscosity correlation or custom table from the Viscosity Correlation drop-down list. From the Gas Type drop-down list you can select dry gas, wet gas, or liquid-rich gas. These selections affect how gas properties are calculated.
Gas Properties, Gas Composition, and Critical Properties can be entered as input parameters in each of their sections. The calculated properties at pi and TR are also displayed.
Gas properties vs pressure are plotted, including Z, ψ, Bg or Bgd, ρg, cg, Rv, VL / Vsat, and μg.
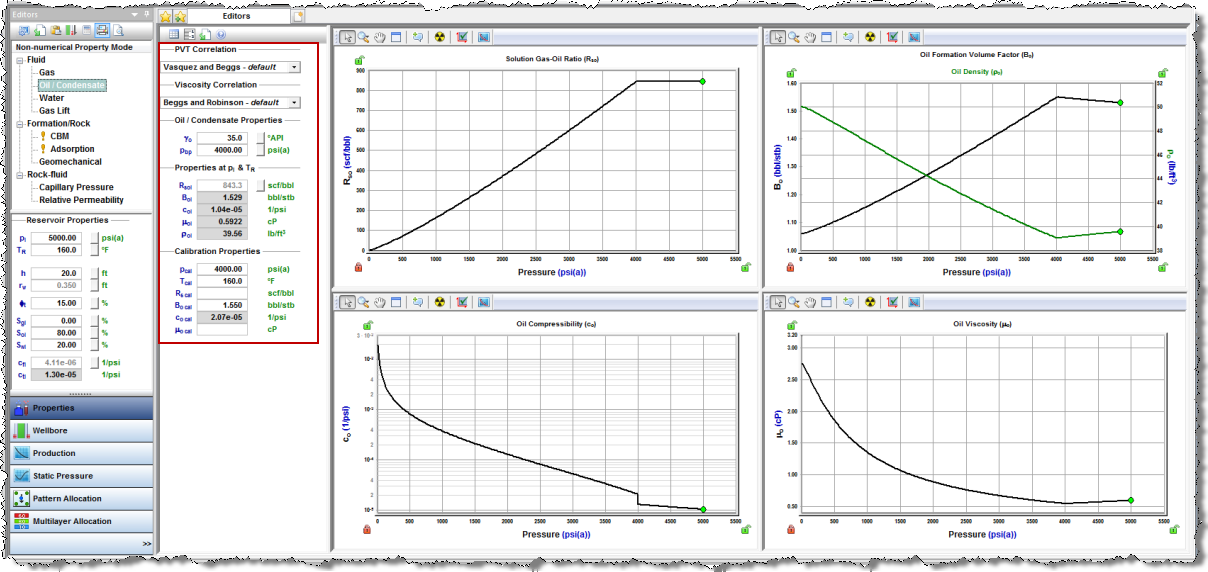
Oil / Condensate Properties
After you select Oil / Condensate in the selection tree, you can select a PVT correlation, constant properties, or custom table from the PVT Correlation drop-down list. Similarly, you can select a correlation, constant properties, or custom table from the Viscosity Correlation drop-down list.
Oil properties can be entered as input parameters. The calculated properties at pi and TR are also displayed. Calibration properties can be entered to calibrate your oil / condensate properties.
Oil properties vs pressure are plotted, including Rso, Bo, ρo, co, and μo.
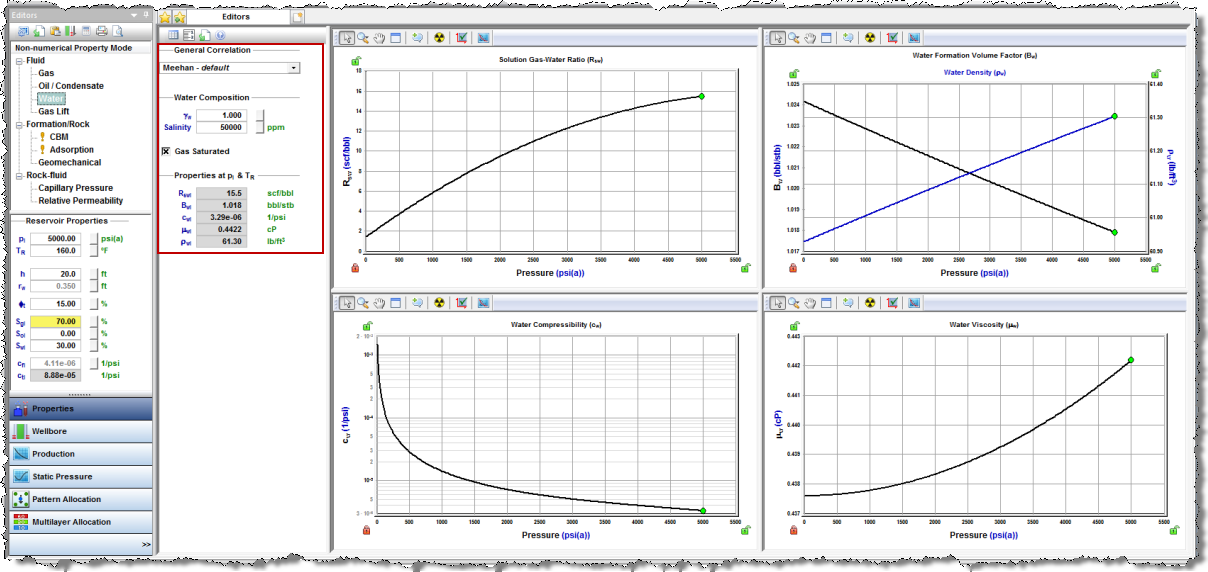
Water Properties
After you select Water in the selection tree, you can select a correlation, constant properties, or custom table from the General Correlation drop-down list.
Water composition can be entered with various input parameters. To account for gas saturation in water, select the Gas Saturated checkbox. The calculated properties at pi and TR are also displayed.
Water properties vs pressure are plotted, including Rsw, Bw, ρw, cw, and μw.
Gas Properties for Gas Lift
After you select Gas Lift in the selection tree, Gas Properties for Gas Lift represents a simplified version of Gas Properties, and it is used for the analyses of gas lift. Only limited options are available for PVT Correlation, Viscosity Correlation, and Gas Type.
Note: It you want to change the PVT Correlation or Viscosity Correlation for your gas lift, you must change these selections in Gas Properties.
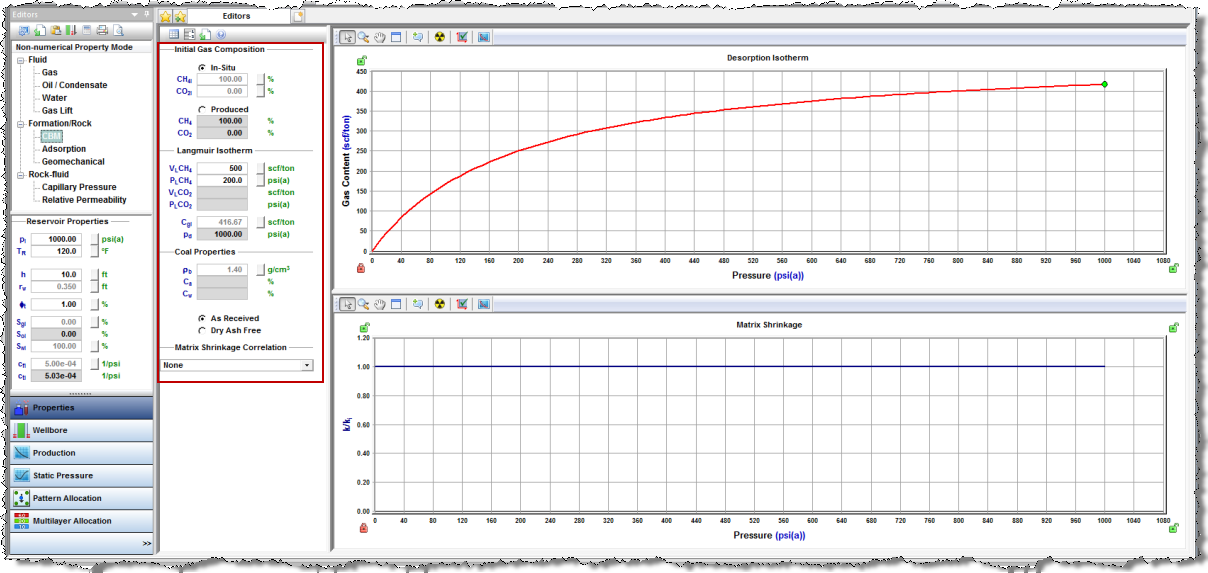
CBM Properties
After you select CBM in the selection tree, Initial Gas Composition, Langmuir Isotherm, and Coal Properties can be entered as input parameters. You can select a correlation, or custom table from the Matrix Shrinkage Correlation drop-down list.
CBM properties vs pressure are plotted, including Gas Content, k / ki, and Φ / Φi.
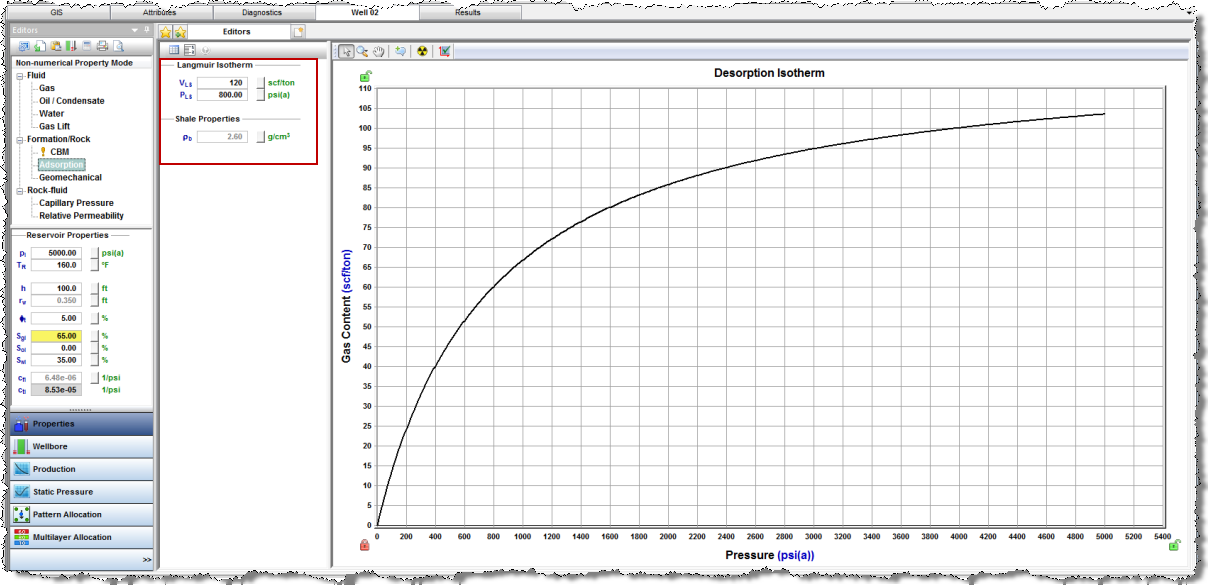
Adsorption Properties
After you select Adsorption in the selection tree, Langmuir Isotherm, and Shale Properties can be entered as input parameters.
Gas content vs pressure is plotted.
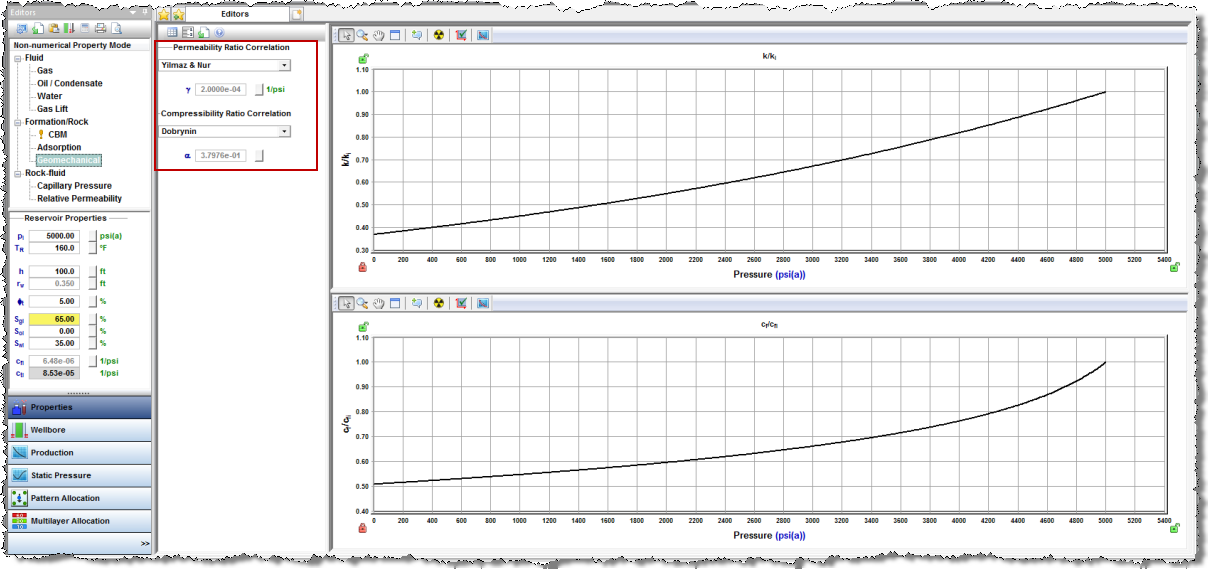
Geomechanical Properties
After you select Geomechanical in the selection tree, you can select a correlation or custom table from the Permeability Ratio Correlation drop-down list. Similarly, you can select a correlation or custom table from the Compressibility Ratio Correlation drop-down list.
Geomechanical properties vs pressure are plotted, including k / ki and cf / cfi.
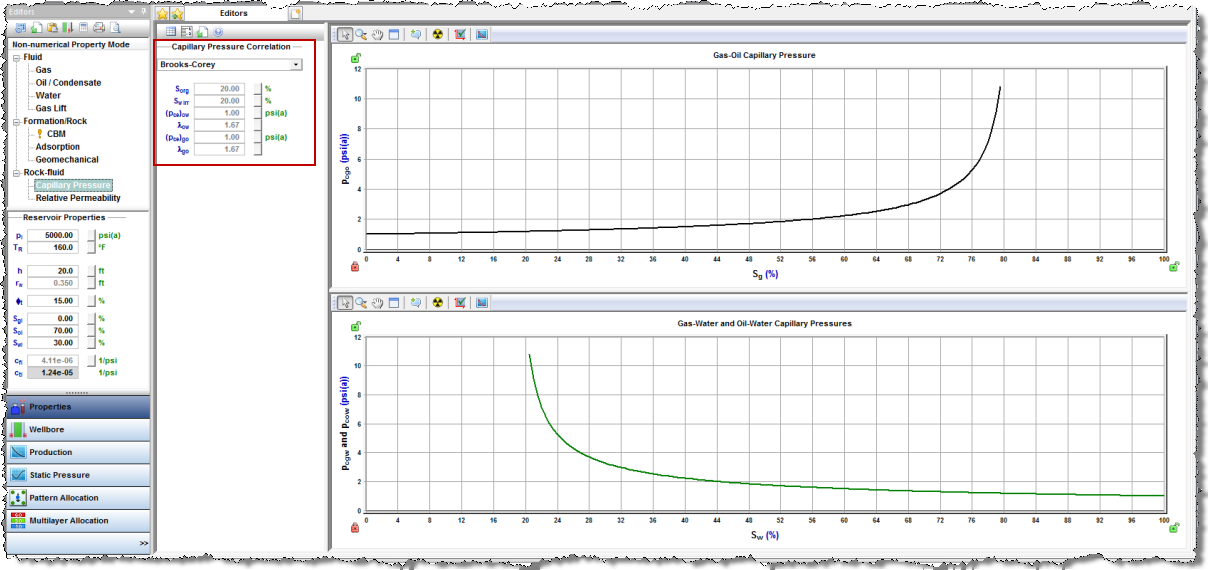
Capillary Pressure Properties
After you select Capillary Pressure in the selection tree, you can select a correlation or custom table from the Capillary Pressure Correlation drop-down list.
Capillary pressures vs pressure are plotted, including pcgo, pcgw, and pcow.
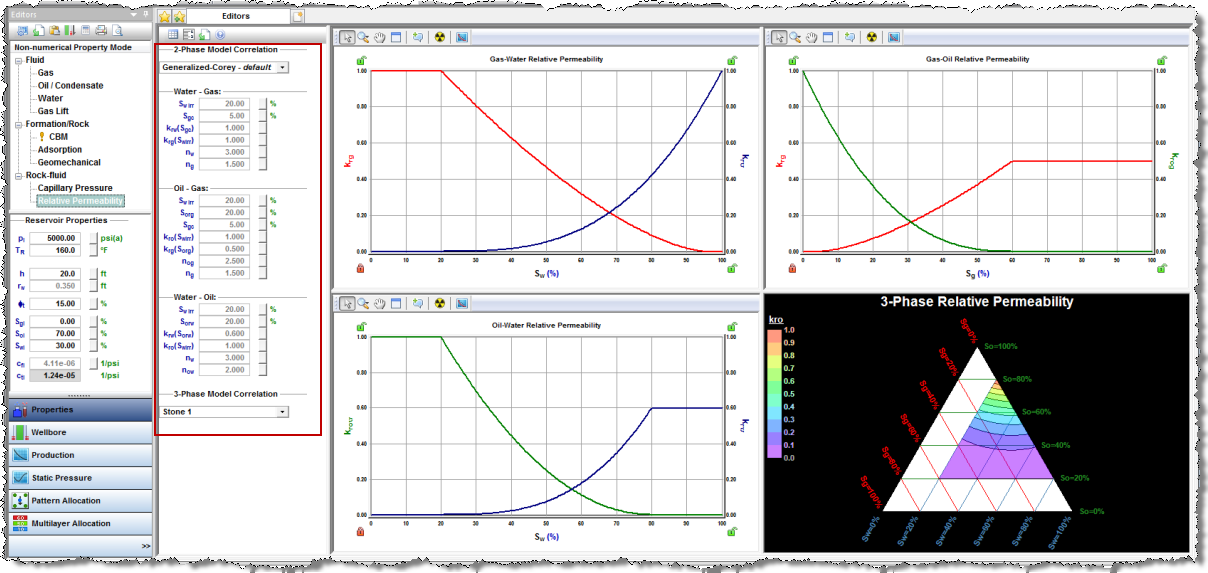
Relative Permeability Properties
After you select Relative Permeability in the selection tree, you can select a correlation or custom table from the 2-Phase Model Correlation drop-down list. The input parameters can be entered for water-gas, oil-gas, and water-oil. You can also select a correlation from the 3-Phase Model Correlation drop-down list.
Relative permeabilities vs pressure are plotted for gas-water, gas-oil, and oil-water. The 3-phase relative permeability is also presented in a triangle graph.
Multilayer Wells: Properties Editor Differences
Single-layer wells vs multilayer wells are contrasted below:
- The Properties Editor is available to the well entity of a multilayered well, and it is also available to layer entities.
- Layout changes for multilayer wells: None
- Functionality changes for multilayer wells: You may enter properties at the well level, or optionally at the layer level. The properties entered for a layer will be used by that layer’s analyses. However the sandface pressure calculations will take its fluid properties from the well entity rather than attempting to mix fluid properties from the layers.
Note: Entering properties at the well level does not automatically propagate to the layer level, or vice versa.
Multi-well Groups: Properties Editor Differences
Single well vs multi-well groups are contrasted below:
- The Properties Editor is available to the group entity of multiple wells in the Custom pane, except the Liquid-Rich Gas option for Gas Type.
- Layout changes for multi-well group entities: None.
- Functionality changes for multi-well group entities: You may enter properties at the well level, or at the group level. The properties entered for a well will be used by that well’s analyses, and the properties for a group will be used by that group's analyses.
Note: Entering properties at the group level does not automatically propagate to the well level, or vice versa.