Unconventional Reservoir Plots
Unconventional reservoir plots are as follows:
| Square Root Time | Type Curve | Schematic | Allowable Ax vs Ad Region |
| Flowing Material Balance | Forecast | EUR vs Drainage Area |
Square Root Time
This plot displays normalized pressure vs square-root time. The square-root time plot displays an automatic best fit of the data. The slope of the best fit line is used to determine the xf√k.
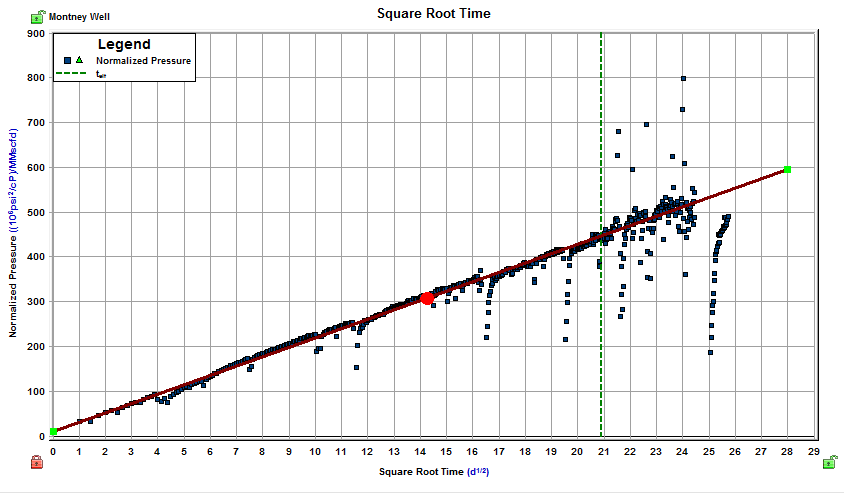
Note: On
constant / variable pressure worksheets, Harmony can calculate "b" according
to your adjustments, if you click the Boundary
Dominated Curve icon (![]() ), and move
the red analysis line on the plot manually.
), and move
the red analysis line on the plot manually.
Flowing Material Balance (FMB)
The FMB plot sets the OOIP / OGIP and area of the stimulated reservoir volume (SRV), and the plot displays an automatic best fit of the data.
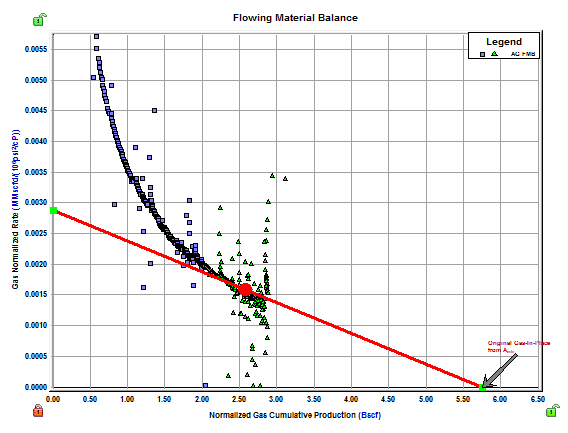
Note: The flowing pressure to be used in the analysis is populated by default from the last portion of pressure data in the production history.
Type Curve
This plot indicates the flow regime. The red line indicates infinite-acting linear reservoir behaviour; the green line indicates bounded reservoir behaviour.

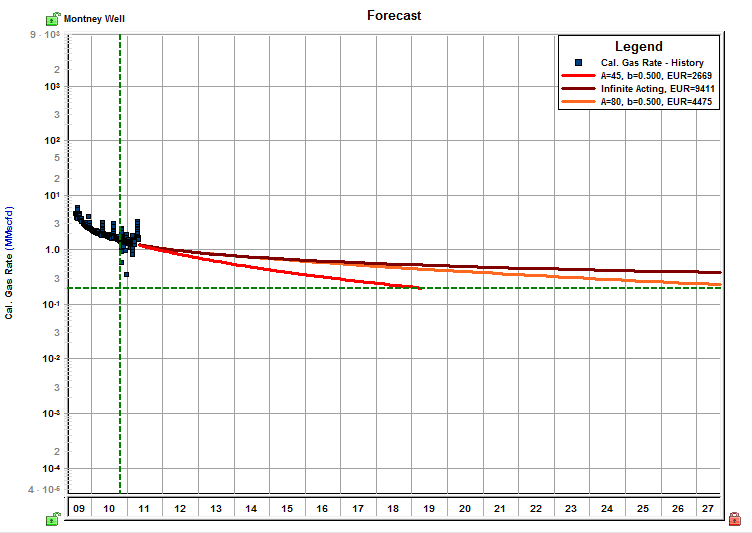
Forecast
The Forecast plot displays the forecast rate. The red line indicates infinite-acting linear reservoir behaviour; the green line indicates bounded reservoir behaviour.
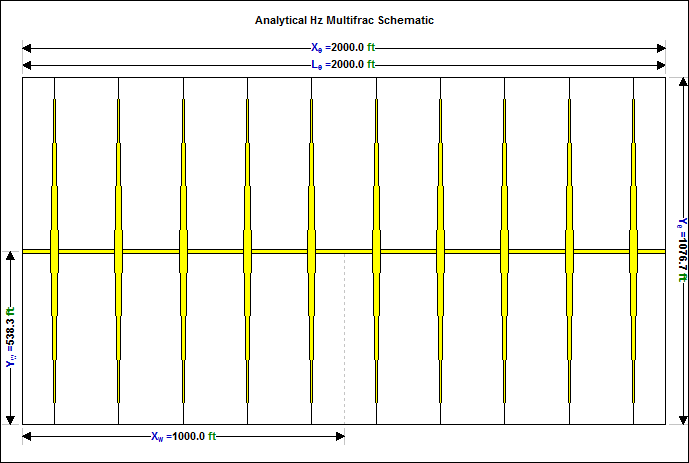
Schematic
In the "most likely" model, the schematic is based on the most likely SRV configuration on the Allowable Ad vs Ax Region plot. In the deterministic model, the schematic is based on the parameters you have entered.
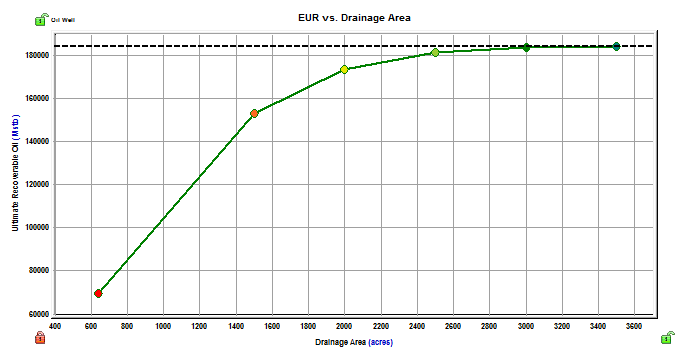
EUR vs Drainage Area
The EUR vs. Drainage Area plot indicates the optimized drainage area. (The point at which the EUR rate flattens radically indicates this area.)
Allowable Ax versus Ad Region
The Allowable Ax vs Ad Region plot defines a region which contains the full set of possible SRV configurations. The point at the center of the mass is used as the "most likely" values.
Note: The Allowable Ax vs Ad Region plot is available only in the Most Likely model.

Fourth Root Time
This plot displays normalized pressure vs fourth-root time. The Fourth Root Time plot displays an automatic best fit of the data, and the plot calculates values based on bilinear flow equations.
