Best Fitting an Analysis
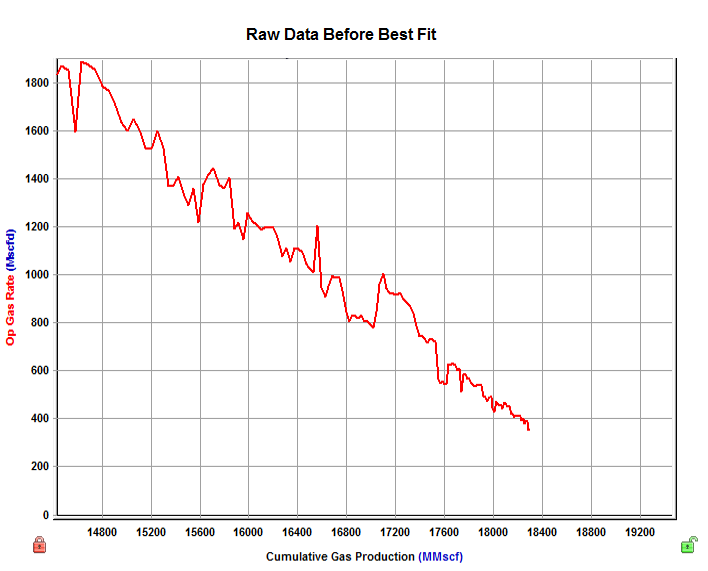
Adding an analysis to a plot creates an analysis line based on the last 50% of the data points. (The Initial Best Fit percentage can be modified in the Decline and Water Oil Ratio sections of the Options dialog box.)
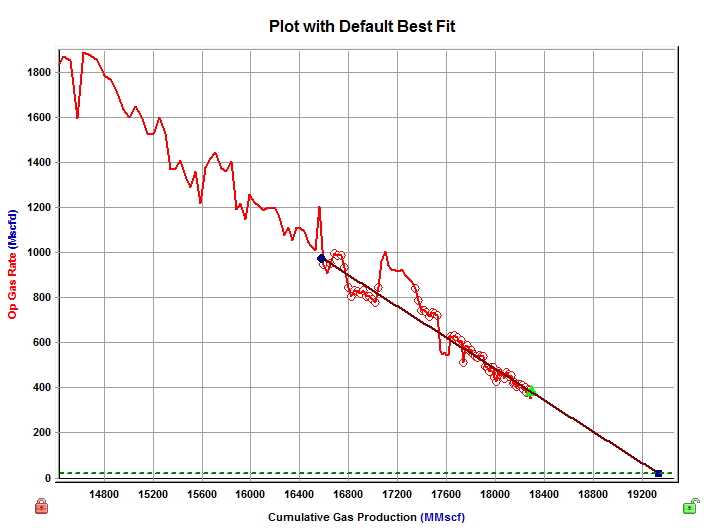
You can create a customized Best Fit by doing one of the following:
- selecting data points on the plot
- selecting a data series and range (type well)
- selecting pressure data points (gas material balance)
- manipulating the decline curve
- fitting a decline to a forecast
- editing parameters associated with the analysis
Once the fit is created, you can evaluate its quality using the "goodness of fit" parameter (R2log q vs. t) located in the Analysis Parameters pane. Better fits are indicated by the goodness of fit parameter being closer to 1.
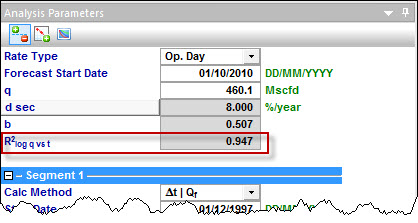
For additional information, see goodness of fit theory.