Manipulating the Decline Curve
Changing the Slope of the Decline Curve
Changing the Forecast Start Date
Changing Initial Cumulative Production & Final Cumulative Production
Changing the b Value & Final Cumulative Production
Changing Final Cumulative Production & Decline Rate
Manipulating Multiple Segments
There are several methods used to manipulate the decline curve that are described below (along with a summary of which parameters change with the manipulation).
Note: There are fewer curve manipulations available for a tight-gas decline (because the b value is locked at 2 for transient flow, and 0.5 for boundary-determined flow), so point selection tends to be an easier way to create a best fit.
When manipulating the decline curve, there are three data points to
be aware of.

1. Left point — any historical data point. (The section between the left point and the forecast start date is not included in the forecast; it is only used to show the match to historical production.)
2. Forecast Start Date — the middle point on the line; this is the forecast start date.
3. End point — the expected ultimate recovery.
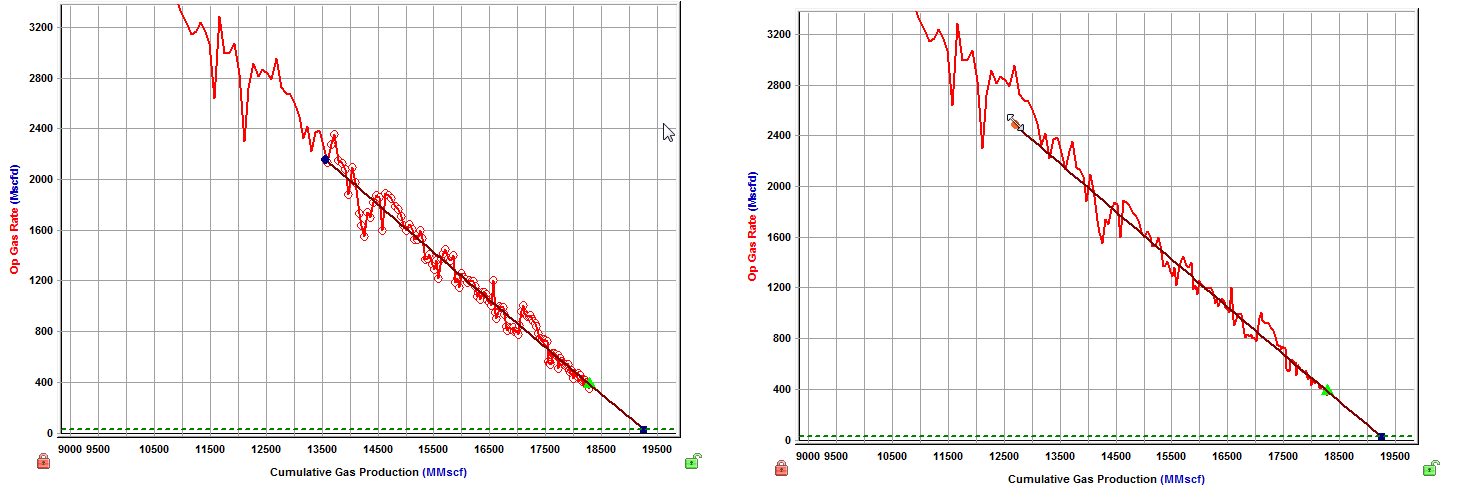
Changing the Slope of the Decline Curve
To change the slope of the decline curve, click the decline curve
line and drag. The line pivots around the Forecast Start Date point, changing the decline
rate and forecast duration. (If you drag the segment that does not have the Forecast Start date within it, the line pivots around the segment's start point.)
Changing the Historical Match
To change the historical match, click the left point while pressing the Shift key, and then drag it to a new position. This changes the portion of the historical production data used, but it does not change the analysis.
Changing the Initial Rate
To change the initial rate, click-and-drag the left point up or down. The initial rate and forecast duration change. Alternatively, you can click-and-drag the Forecast Start Date point up or down.

Changing the Forecast Start Date
To change the forecast start date, enter a new date in the Forecast Start Date field in the Analysis Parameters pane.

If you click-and-drag the Forecast Start Date point left or right while holding down the Ctrl key, the Forecast Start Date point moves together with the decline curve.
If you click-and-drag the Forecast Start Date point left or right while holding down the Shift key, the Forecast Start Date point moves along the decline curve (the curve itself does not move).
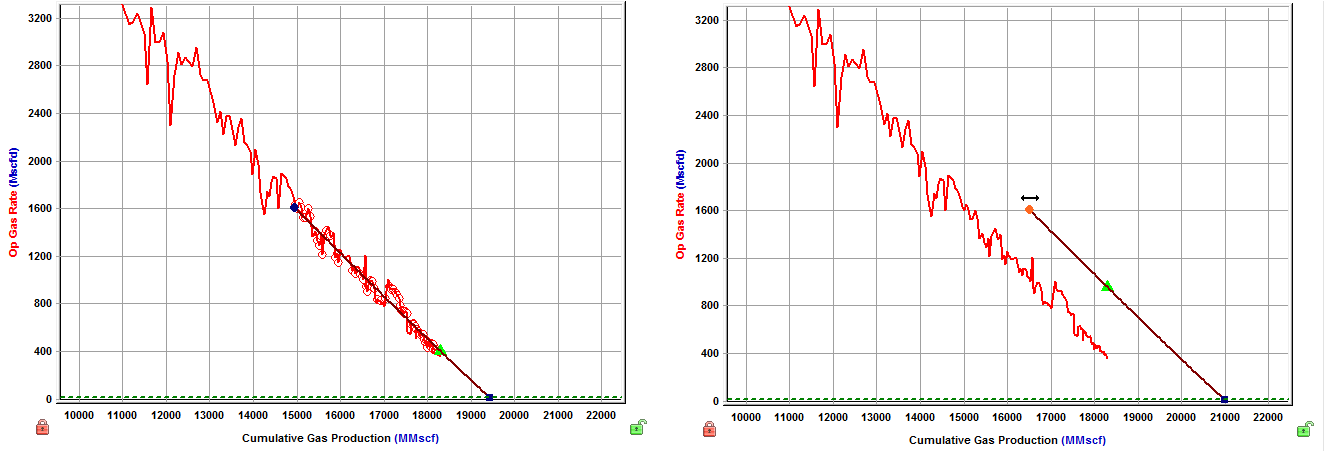
Changing Initial Cumulative Production & Final Cumulative Production
To change the initial cumulative production and final cumulative production, click-and-drag the left point while holding down the Ctrl key. This changes the start point without changing the initial oil / gas rate or decline rate.
Changing the b Value
To change the b value, click-and-drag the decline curve while holding down the Ctrl key. This changes the decline exponent value and the start point, while the left point and end point remain fixed. (The gray guidelines represent decline exponents of 0 and 1.)

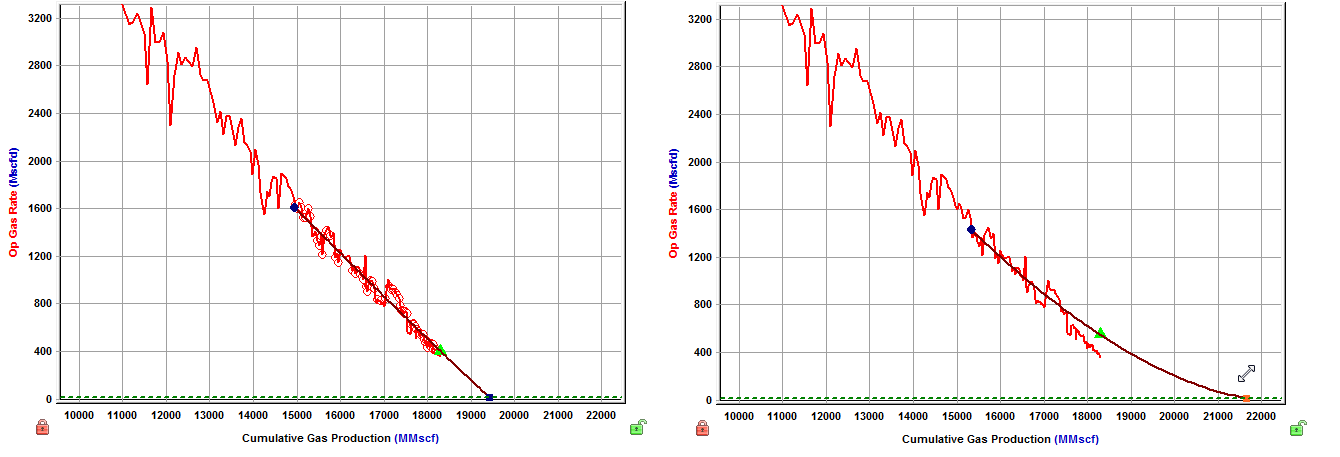
Changing the b Value & Final Cumulative Production
To change the b value and final cumulative production while maintaining the initial gas / oil rate, drag the end point while holding down the Ctrl key. (This method does not show the gray guidelines.)
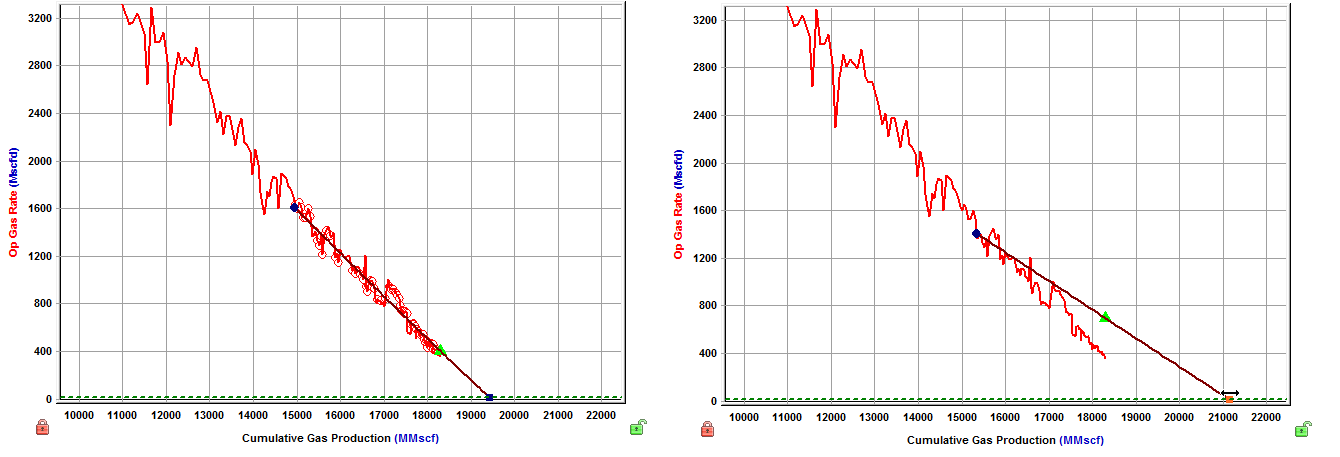
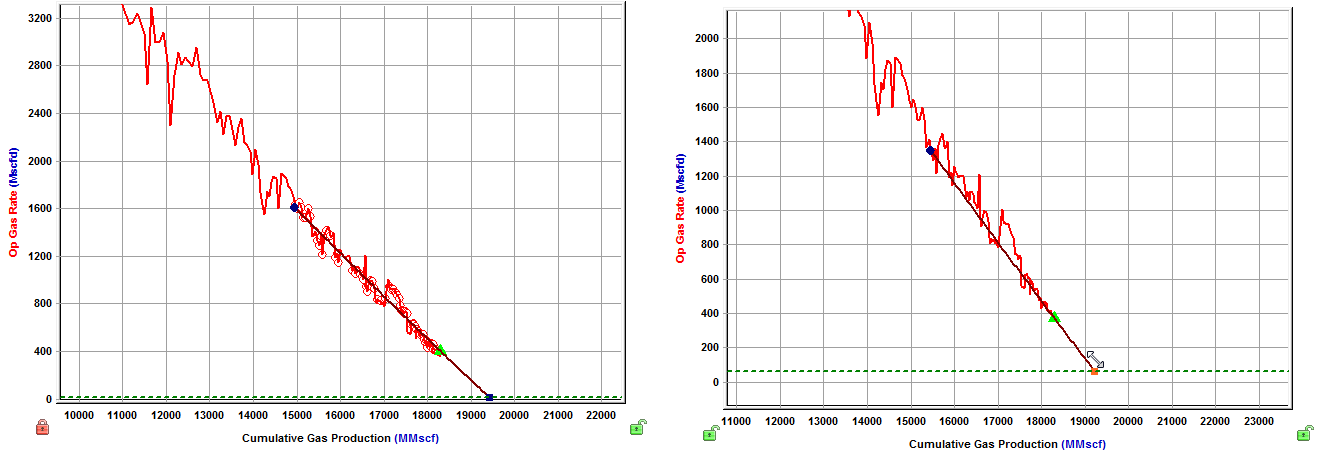
Changing Final Cumulative Production & Decline Rate
To change the final cumulative production and the decline rate, drag the end point left or right. This changes the cumulative production of the segment and the forecast duration, without changing the final rate. The initial gas / oil rate and decline rate are also changed.
Changing the Abandonment Rate
To change the abandonment rate, drag the end point while holding down the Shift key. The final rate, cumulative production, and forecast duration are changed without changing the decline exponent, or effective decline rate.
Manipulating Multiple Segments
Individual segments can be best fit to the corresponding data interval by using the data selection tool, and choosing data points between the start and end date of that segment.
Alternatively, selecting data points that span multiple segments best fits each segment to the points that lie between their individual start and end dates.

When best fitting using the data selection tool, the start date of the first segment corresponds to the first data point that is selected. The end date of the first segment can be changed by clicking-and-dragging the point left or right.
The end date of the first segment corresponds to the start date of the second segment. These dates are always be the same; however, the initial rate of the second segment does not necessarily have to be the same as the final rate of the first segment. (Additional segments can be added as needed.)
Manipulating Multi-Segment Decline
A multi-segment decline is initially "best fit" using all data points as follows:
- with the start date of the first segment equal to the start of production
- the end point of the first segment defined by the constraints entered in the Options dialog box
- the start date of the second segment equal to the end date of the first segment
- the end date of the second segment defined by the final gas rate
The first and second segments are always continuous, with the end date of the first segment equal to the start date of the second segment. As well, the instantaneous decline rate at the end of the first segment is equal to that at the beginning of the second segment.
Due to the continuity between the first and second segments, manipulating the shape of the first segment's decline curve impacts the second segment's decline curve.
All line manipulations described above can be applied to the multi-segment decline analysis. The length of the first decline segment can be changed by clicking the end point of the first segment and dragging left or right.

Manipulating Lines
Line manipulations are initiated by clicking (sometimes while pressing the Ctrl or Shift keys) the line itself, or one of the manipulation points for a given segment (start date, forecast start date, or end date). You can cancel your line manipulation by pressing the Esc key. Specific line manipulations are described below:
Any time you see "click", this means to left-click your mouse. Right-click actions are specifically mentioned.
- Forecast Start Date, FSD (indicated by a green triangle on the decline line)
- Click, grab-and-drag — maintains the shape of the decline line and the b and d values. Enables vertical shifting of the decline line, which results in changes to q and qi.
- The segments after the segment containing the FSD are also affected because they are shifting in time / cumulative production. - Shift key — pressing the Shift key while dragging enables you to position the FSD along the decline curve, while maintaining the shape of the decline. This changes your Qf (only on a rate-time Decline worksheet).
- Positioning of the FSD beyond the historical production is restricted on a rate-cumulative (RC) production decline. - Ctrl key — pressing the Ctrl key while dragging enables horizontal shifting (translation) of the decline with time. This impacts the FSD in time on a rate-time (RT) plot, but the decline parameters remain unchanged.
- If the FSD is located on the second segment, pressing the Ctrl key results in behavior similar to "click, grab-and-drag" on the second segment.
- Click, grab-and-drag — maintains the shape of the decline line and the b and d values. Enables vertical shifting of the decline line, which results in changes to q and qi.
- Start Date (indicated by a blue circle)
- Click, grab-and-drag — moves the decline line vertically to change the qi of the segment. However, it does not change the start date or FSD. The shape of the decline (b and d) line is preserved.
- Both qi and q for the segment being manipulated get modified, and all segments following this segment are shifted in time / cumulative production, accordingly. - Shift key — pressing the Shift key while dragging extends your forecast back into the historical production. The start date, qi, and di change, but the b value is not impacted.
- This Shift-key functionality does not apply to a secondary segment. - Ctrl key — pressing the Ctrl key while dragging translates the curve along the x-axis. The start date, FSD, and forecast end date advance in time for the first segment.
- This Ctrl-key functionality does not apply to a secondary segment.
- Click, grab-and-drag — moves the decline line vertically to change the qi of the segment. However, it does not change the start date or FSD. The shape of the decline (b and d) line is preserved.
- End Date (indicated by a blue square)
- Click, grab-and-drag — enables you to move the end date in time, anchoring to the start date and maintaining the qf. The b value is maintained, but di is updated. If the FSD is contained within the segment, then q and d update as well.
- Shift key — pressing the Shift key while dragging extends your forecast forward in time, and decreases your final rate (qf). Your final Qf increases, but none of the decline parameters change.
- Ctrl key — visually similar to the grab-and-drag functionality for the end date, but the b value can change with the Ctrl-key functionality.
- Any point on the forecast decline curve (activated when the decline segment turns orange)
- Click, grab-and-drag — If the segment contains the FSD, that segment is anchored to the FSD and rotates around while the b value and qf are maintained.
- On a segment that does not contain FSD, the decline is anchored to the start date of the segment.
- If you accidentally place the FSD at the end date of a segment, the decline is anchored to the end date of the segment. - Ctrl key — the curvature of the line (the b value) changes.
- Click, grab-and-drag — If the segment contains the FSD, that segment is anchored to the FSD and rotates around while the b value and qf are maintained.