You can use the flowing material balance (FMB) analysis as a practical technique to estimate hydrocarbons-in-place from production rates and pressures. It uses precisely the same principles as a classical material balance analysis, but requires no shut-in data. It is designed for wells that have reached boundary-dominated flow, but can also be used to identify minimum original gas / oil in place (OGIP / OOIP) in transient cases. For additional information, see FMB theory.
After an FMB analysis is created, data points are displayed on the plot. A portion of the data representing boundary-dominated flow should follow a straight line. Locate the analysis line that goes through the boundary-dominated (late) portion of the data. The original fluid in-place (OGIP, OOIP, or OWIP) is calculated based on the position of the analysis line.
Note: This analysis works with your Harmony Reservoir™ license.
If you analyze a group of wells, you can change which well is displayed by selecting your well from the Primary Well drop-down list. Note that there is no interpretation for these well completion parameters: skin and fracture half length.
Plot Options
Plot options define which datasets are displayed on the plot.
For Gas FMB:
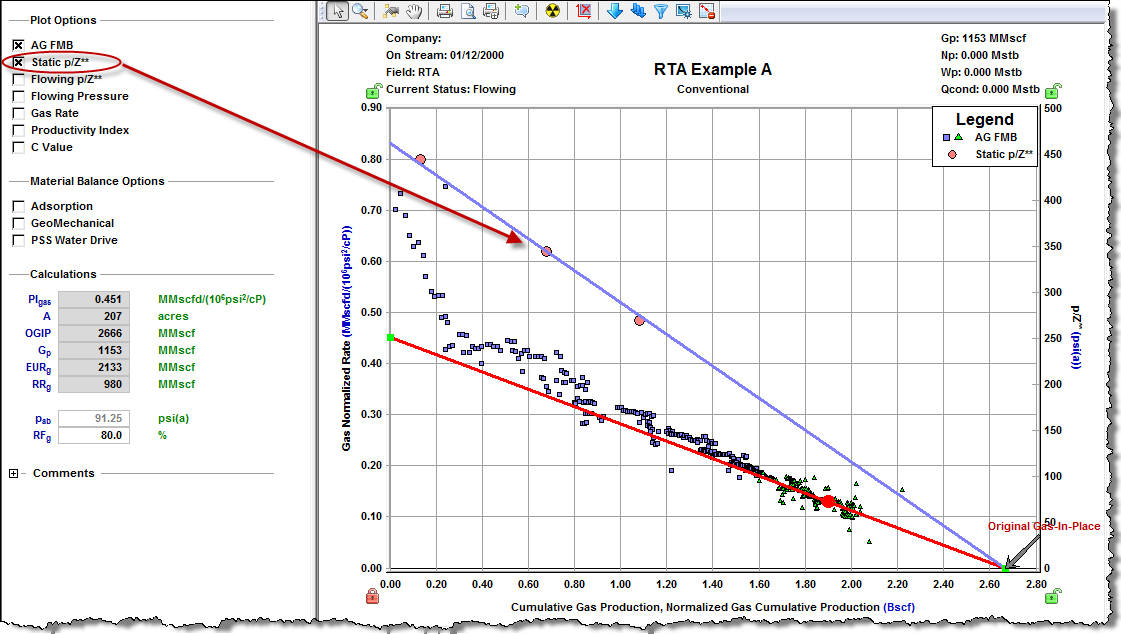
- AG FMB — Agarwal-Gardner FMB plots normalized rate versus Normalized Cumulative Production. The underlying calculation is described in Agarwal-Gardner normalized rate.
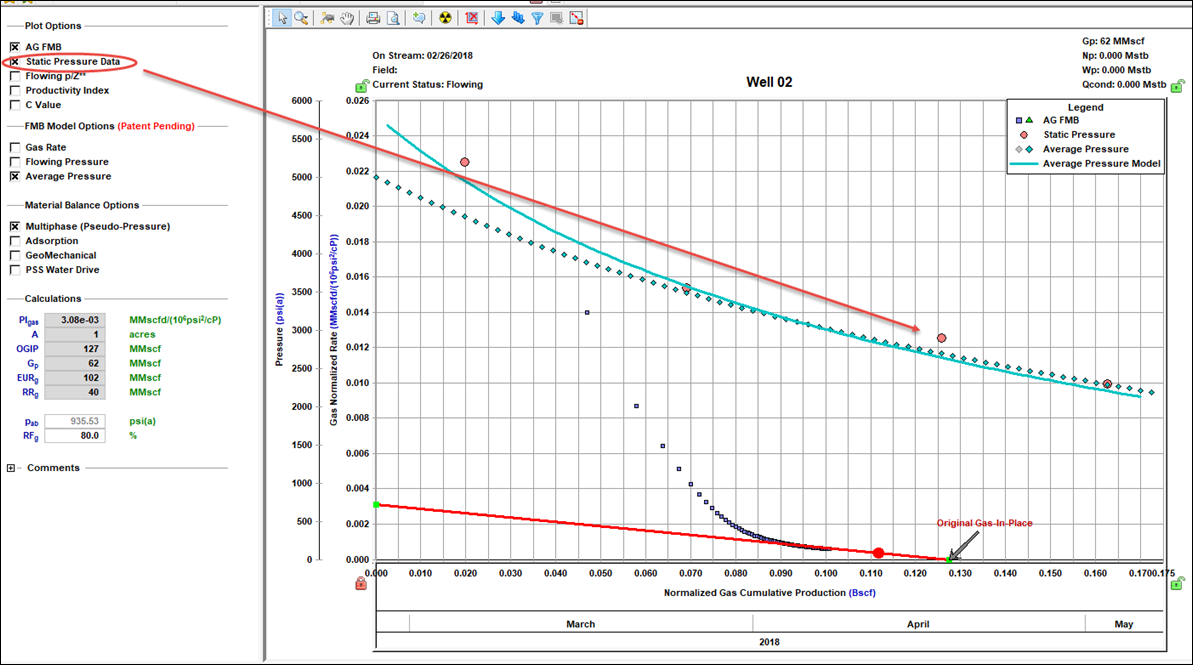
- Static Pressure Data — if static pressures are available, you can use this data as an independent confirmation of the OGIP:
- in single-phase mode (when the Multiphase (Pseudo-Pressure) option is deselected) — Static p/Z** is plotted against Cumulative Gas production. A straight line drawn through this data defines OGIP. Estimates of OGIP based on flowing pressures and static pressures should be consistent.
- in multiphase mode (when the Multiphase (Pseudo-Pressure) option is selected) — static pressure is plotted against date. If the estimate of OGIP is correct, average pressures are calculated using FMB Model Options / Average Pressures, and static pressures should be consistent.
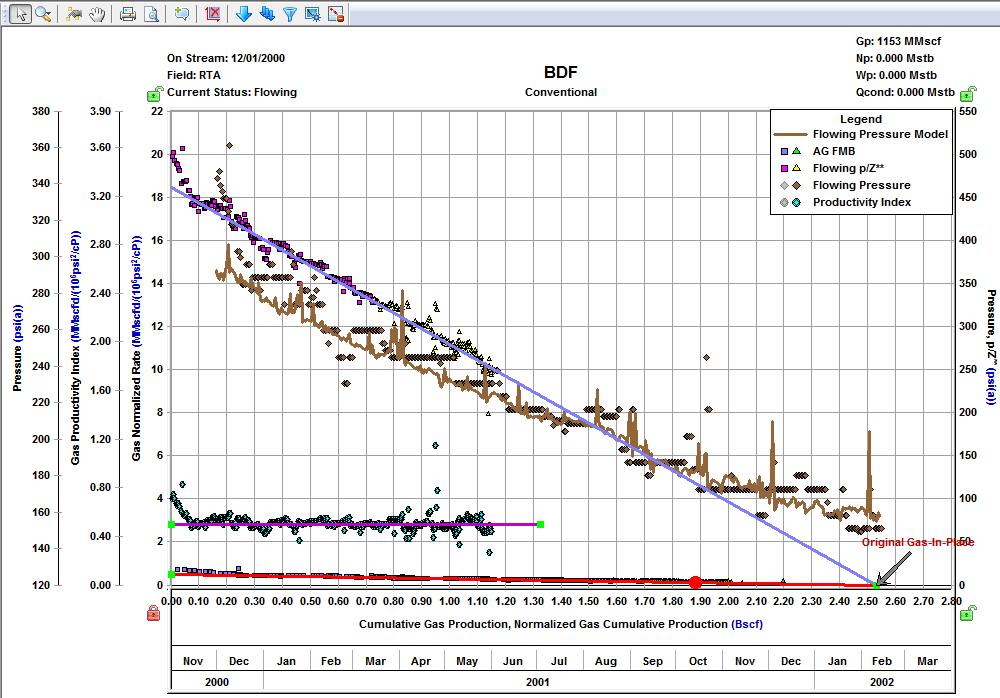
- Flowing p/z** — plots flowing p/z** versus Cumulative Gas Production. The underlying calculation is described in variable rate flowing p/Z**.
- Productivity Index — plots the productivity index versus Cumulative Gas Production. If the correct OGIP is calculated from the material balance analysis, the productivity index for the boundary-dominated portion of the data should plot as a flat line. A downward sloping line can be an indication that the calculated volume is too large, while an upward sloping line can indicate that the calculated volume is too small. Productivity indexes that fall off a flat line can also be an indication of operational issues with the well. The underlying calculation is described in productivity index.
- Note: AG FMB, Flowing p/Z**, and the Productivity Index plots are different ways to display the same set of production data; therefore, the results of these three analyses should be in agreement. That is why the analysis lines for these three plots are linked to each other and always give the same OFIP.
- Flowing Pressure — flowing pressure points are not used in the analysis, but can be displayed as a reference.
- Gas Rate — gas rates are not used in the analysis, but can be displayed as a reference.
- C Value — coefficient values in the simplified absolute open flow (AOF) equation are not used in the analysis, but can be displayed as a reference.
For Oil FMB:
- Oil FMB — plots normalized rate versus Normalized Cumulative Production. The underlying calculation is described in oil theory.
- Static Pressure — if static pressures are available, you can use this data as an independent confirmation of the OOIP:
- in single-phase mode (when the Multiphase (Pseudo-Pressure) option is deselected) — static pressure is plotted against
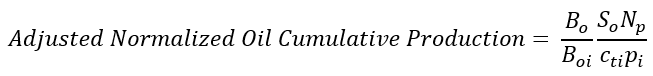 .
.
A straight line drawn through this data defines OOIP. Estimates of OOIP based on flowing pressures and static pressures should be consistent. - in multiphase mode (when the Multiphase (Pseudo-Pressure) option is selected) — static pressure is plotted against date. If the estimate of OOIP is correct, average pressures are calculated using FMB Model Options / Average Pressures, and static pressures should be consistent.
- in single-phase mode (when the Multiphase (Pseudo-Pressure) option is deselected) — static pressure is plotted against
- Gas-Oil ratio — are not used in the analysis, but can be displayed as a reference.
FMB Model Options (Patent Pending)
FMB model options include the following:
- Oil Rate — uses the measured flowing pressure to calculate a synthetic oil rate, and compares the synthetic and measured oil rates. Modifies the productivity index and the original-oil-in-place, N, until an acceptable history-match of the oil rates is obtained.
- Flowing Pressure — uses the measured oil rate to calculate a flowing pressure, and compares the synthetic and measured flowing pressures. Modifies the productivity index and the original-oil-in-place, N, until an acceptable history-match of the flowing pressures is obtained.
- Average Pressure — uses the measured flowing pressure and the flowing oil rate to calculate a synthetic average reservoir pressure. Modifies the productivity index and the original-oil-in-place, N, until an acceptable history-match of the average pressure is obtained.
Material Balance Options
Material balance options include the following:
- Multiphase (Pseudo-Pressure) — accounts for the variation of oil properties with pressure. For more information, see accounting for changing oil properties.
- Adsorption (for Gas FMB) — corrects the data to include adsorbed gas. For more information, see accounting for adsorbed gas-in-place.
- GeoMechanical (for Gas FMB and Oil FMB) — accounts for the variation in rock properties (permeability and formation compressibility) with pressure. For more information, see including pressure-dependent permeability and formation compressibility.
Note: For the Oil FMB analysis, this option is only available if the Changing Properties (Pseudo-Pressure) option is selected. - PSS Water Drive (for Gas FMB and Oil FMB) — accounts for water drive (additional water drive analysis parameters are displayed). For more information, see analyzing reservoirs with aquifer support.
Calculations
Harmony Enterprise calculates the original fluid in-place based on the position of the analysis line. This value is displayed in the Calculations section, along with some additional parameters.

Plot toolbar
This toolbar has the following important icons:
-
 Single Annotation — adds a single annotation to a specific point on your dataset.
 -
 Linked Annotations — synchronizes your annotation across all plots for FMB, URM, and typecurve analyses. For example, if you move your annotation on one plot using the keyboard arrow keys, the arrow is synchronized on the other plots.
 -
 Data Filter — opens the Data Filter dialog box where you can apply a data filter. For more information, see filtering.
 -
 Rate Type Option — select either Calendar Rate or Operated Rate.
 -
 Hide / Show Disabled Points — toggle between hiding and showing data points that have been disabled.
For information on common plot icons, see plot toolbars.
Filtering
If you believe some of the production data points are of poor quality, or are outliers, you can filter them out (disable these points). To do this, click the Data Filter icon (![]() ) in the FMB plot toolbar. Then, click the Tools to Select Data Points for Filtering icon (
) in the FMB plot toolbar. Then, click the Tools to Select Data Points for Filtering icon (![]() ) in the Data Filter dialog box (opens when you click the Data Filter icon) to select and deselect the data points you want. Click to select points, and right-click to deselect points.
) in the Data Filter dialog box (opens when you click the Data Filter icon) to select and deselect the data points you want. Click to select points, and right-click to deselect points.
Filtered-out (disabled) points are displayed in gray in the FMB plot. (You can hide these points by clicking the Hide / Show Disabled Points icon (![]() ).)
).)
Tip: Selection of filtered-out (disabled) points is shared between all FMB, unconventional reservoir, and typecurve analyses for the same fluid type. In addition, these selections are saved when you export to a local database, or import from a local database.
Best fitting
When you use the spray gun icon (![]() ) to select data points, you are selecting data points for best fitting (with a normal, or 10% weighting). The analysis line is redrawn to best-fit through the points you selected. If you move the best-fist line (for example, by dragging and dropping), the best-fit selection resets. You can have different selections for best fitting different analysis, and your best-fit selection is saved when you export to a local database, or import from a local database. For more information, see export data and import from an .hldb file.
) to select data points, you are selecting data points for best fitting (with a normal, or 10% weighting). The analysis line is redrawn to best-fit through the points you selected. If you move the best-fist line (for example, by dragging and dropping), the best-fit selection resets. You can have different selections for best fitting different analysis, and your best-fit selection is saved when you export to a local database, or import from a local database. For more information, see export data and import from an .hldb file.