The Gas IPR / TPC analysis method creates tubing performance curves (TPCs) for a gas well, and overlays them on the sandface inflow performance relationship (IPR) curves. For reference material, see Gas IPR / TPC theory and choke sizing.
This analysis works with your Harmony Optimize™ license. For information on options, see Optimize options.
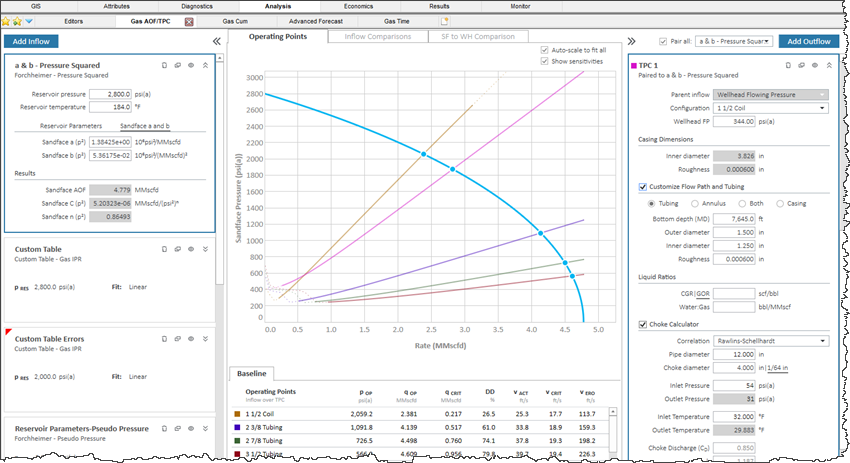
For a given set of conditions, a TPC is a plot of the flowing sandface pressure, as a function of flow rate. This curve does not change through the life of the well. It is not at all dependent upon well performance; it depends only upon the gas-liquid ratio, tubular configuration (depth, diameter), wellhead pressures, etc.
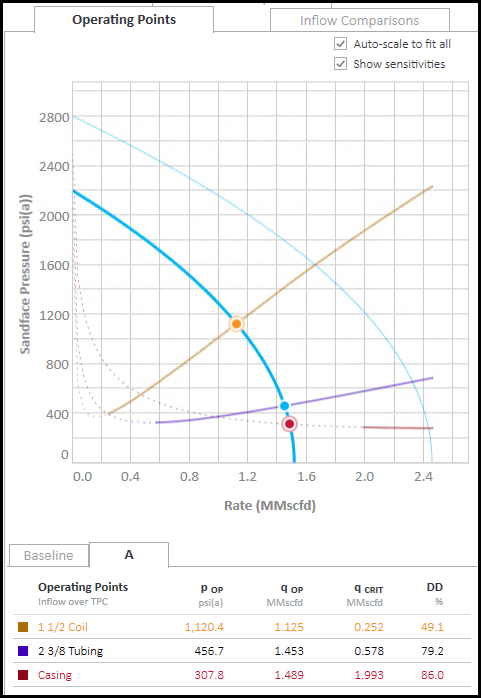
On the Gas IPR / TPC plot, flow within safe operating conditions is denoted by a solid TPC line. Flow categorized as an operational risk is denoted by a dashed TPC line. Hover over the tooltip for additional context as to whether this is liquid loading and/or erosion.
The active IPR is highlighted with a blue border on the left-side of the main pane and the active TPC is highlighted on the right-side. In addition, the active TPC and IPR curves are displayed in bold when you hover over the plot. Click the inverted chevron icon (![]() ) to open your IPR or TPC.
) to open your IPR or TPC.
This analysis has the following icons in the Inflow and Outflow panes:
-
 Delete — removes the currently selected inflow, outflow, gradient, or forecast.
 -
 Copy — creates a duplicate of the currently selected inflow, outflow, gradient, or forecast. The name is appended with the word "Copy".
 -
 /
/  Show / Hide — toggle between showing or hiding the inflow, outflow, gradient, or forecast.
 -
 /
/  Collapse / Expand — closes / opens the details for the inflow, outflow, gradient, or forecast. If you see a red triangle (
 ) in the top left of a collapsed analysis, you need to investigate the required parameters.
Inflow pane
The Inflow pane on the left-side has the following items:
- Inflows — click the Add Inflow button to create an inflow that is measured at the sandface.
- Simplified C, n — the Simplified equation (C, n) is a widely accepted method for describing a well’s deliverability (IPR) potential. Well test data (C, n, and reservoir pressure) can be entered directly, or an estimate can be made by entering reservoir pressure and a single test point. This equation set also contains an “Injection” option.
- Forchheimer — the Forchheimer equation can be used to estimate a well's IPR potential. Well test data (a, b, and reservoir pressure and temperature) can be entered directly, or an estimate can be made by entering several reservoir parameters (net pay, porosity, water saturation, and several others).
- Custom Table — instead of an equation, the IPR can be described with two or more test points that are entered in tabular form. By default, all the test points are connected with straight lines (linear fit), but the points can also be fit to the Forchheimer equation.
- Configuration drop-down list — select the wellbore configuration or optimize configuration you want to use when converting from wellhead to sandface pressure. For more information, see optimize configurations.
For the inflow method, wellhead non-flowing pressure, the following flow paths are not supported: Both, Casing, Gas Lift, and Pumping.
For the inflow method, wellhead flowing pressure, the following flow paths are not supported: Gas Lift and Pumping.
Plot
The plot in the center of the window has the following items:
- Plot — the plot is displayed after you type all the required parameters. Intersections on the plot correspond to the points in the Operating Points table. The axes operate in the same manner as Economics. For more information, see Y-axis icons and X-axis icons. To rescale the plot back to its original settings, double-click it.
- Auto-scale to fit all checkbox — fits the plot to the maximum viewable area of the screen.
- Show Sensitivities checkbox — displays sensitized / transient inflows in the plot with a light-blue line, as well as inflows in the Operating Points table.
- Show all valve curves checkbox — displays the outflow for every valve depth entered in the Optimize Configuration (only applies to the artificial lift outflow). If deselected, the deepest valve depth that calculates a valid operating point is used to display the outflow curve.
- Operating Points tab — this is the default plotting method that can show sandface IPR curves overlaid with TPCs. If at least one IPR and TPC are paired, then the intersection of the IPR and TPC is called the operating point. The operating points are then displayed in a table below the plot. Note that you can copy the table by right-clicking it and selecting Copy Table.
- Inflow Comparisons tab — this can be used to display both the sandface and wellhead IPR curve, if the wellhead IPR can be calculated.
- SF to WH Comparison tab — displays a plot for sandface-to-wellhead comparisons.
Outflow pane
(Operating Points tab only) The Outflow pane on the right-side has the following items:
- Pair all with checkbox — click this option, if you want to pair all TPCs with the inflow selected in the drop-down list to the right.
- Parent inflow drop-down list — select from the drop-down list.
- Add Outflow button — click to create a TPC. Type values or select from drop-down lists for fields in white. Gray fields are read-only. Note that all TPCs require a parent inflow and a wellbore.
- Configuration drop-down list — by default, the most-recent configuration is selected. If there is a red box around the Configuration drop-down list, you need to make corrections in the Wellbore editor.
- Add / Edit link — opens the Wellbore Editor popup where you can create, delete, and edit Optimize Configurations without leaving the worksheet.
- Wellhead FP field — type your wellhead flowing pressure.
- Liquid Ratios section — select from the drop-down list, so you can type values for your ratios.
- Gas Lift inputs — only available when your selected configuration has its flow path set to Gas Lift - Tubular or Gas Lift - Annular.
Reservoir Liquid Ratios — converted from the Liquid Ratios section for Gas Lift Outflows. These inputs indicate the producing fluid ratios excluding gas lift injection volumes.
Injection Pressure — type your injection-side flowing pressure. This is in the opposite direction of the flow path.
Injection Gas Rate — type your intended gas lift injection rate.
Injected Gas Gravity — displays the specific gravity of the injected gas. To edit this value, navigate to Editors, Properties, Gas Lift.
- Choke section — only available when your selected Optimize configuration has a choke.
Correlation — select the choke correlation from the drop down list
Discharge coefficient — type your discharge coefficient. The default is the value in the wellbore editor
Choke diameter — read-only display of choke diameter
Choke depth — read-only display of measured depth of choke
If you click the SF to WH Comparison tab, the Wellbore Reference pane is displayed instead of the Outflow pane.
Choke
After selecting an Optimize configuration with a choke installed in the wellbore, the analysis card will display the Choke subsection, and pressure drop calculations across the choke will automatically be performed.
In addition, the critical flow rate (sonic flow rate) is also calculated to determine the maximum rate of the TPC on the plot. Consequently, if the operating point is at a rate below the critical flow rate, a warning message is displayed on the TPC’s analysis pane.
Diagnostics
The operating points are displayed in one of the following colors:
- Dark blue — the operating point is in the preferred range. In other words, the operating point is above the critical rate required to lift liquid, and below the erosional velocity.
- Red — the operating point is below the critical rate required to lift liquid.
- Yellow — the operating point is above the erosional velocity calculated for this configuration.
You can set your default erosional velocity in the Options dialog box under the Optimize node. You can set liquid-loading options in the Wellbore editor. We recommend that you recreate TPCs in a flowing gradient worksheet for a full flowing assurance analysis.
In addition, the table below the plot displays text in a yellow font when erosion is predicted, and in a red font when liquid loading is predicted.
Operating Points table
The Operating Points table at the bottom of the window has the following key performance indicators (KPIs):
- Baseline tab — this shows the KPIs for the baseline (or primary) IPR.
- Additional tabs:
- A, B, and C tabs — are displayed if you use the Future Inflows option in Simplified (C,n) IPRs.
- T1, T2, and T3 tabs — are displayed if you use a Forchheimer IPR and the transient inflows are calculated.
You can view your sensitivities if the Show Sensitivities checkbox is selected at the top of the window.
Note that you can view your H2S rates for each of the operating points when the H2S% in the Editors tab is greater than 0%.