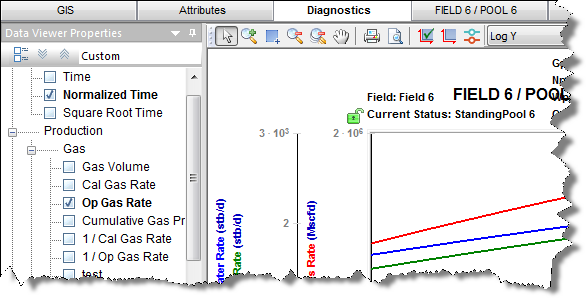
The Diagnostics tab displays customizable plots consisting of production, injection, and pressure data for each entity in a Harmony project. Selecting parameters in the Data Viewer Properties pane displays these items on the plot.
You can send your plot to a comparison plot, by right-clicking it and selecting Send Plot to Comparison Plot. You can also right-click a dataset in the plot and select Send Dataset to Comparison Plot. For information on other options, see plot options.
Note: If a custom dataset does not exist when a template is applied, the dataset is not added to the plot.
This tab has two toolbars: a primary toolbar for the Data Viewer Properties pane and a secondary toolbar above the plot. For a description of common icons, see toolbars.
The important item on this toolbar is the Template drop-down list.
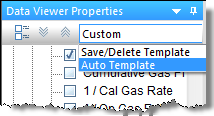
Auto Template is the default setting, but you can select Save / Delete Template in order to create a template with the plot selections / datasets you prefer. This template can also be used in a custom worksheet to perform a decline analysis or ratio analysis. For more information, see the Save Template dialog box.
The secondary toolbar is above the plot, and in addition to the common toolbar items, has the following items:
Right-clicking within the Data Viewer's tree structure displays the same context menu as for a pane.
Right-clicking within the Diagnostic plot (the main pane) displays plot options.
IHS Harmony™ 2016b Multi-User | Last revised: October 19, 2016
Copyright © 2016 IHS Inc.