Minifrac Pre-Closure Analysis
Subtopics:
Instantaneous Shut-In Pressure
Introduction
The analysis of minifrac test data is performed in two parts: pre-closure analysis (PCA) and after-closure analysis (ACA).
Pre-closure analysis consists of identifying closure and analyzing the early pressure falloff period while the induced fracture is closing. One of the most critical parameters in fracture treatment design is the closure pressure. One specialized analysis technique used to identify closure is, in pressure transient parlance, the G-Function Analysis.
The following parameters are determined from the PCA:
- Fracture closure pressure (pc)
- Instantaneous Shut-In Pressure (ISIP) = Final injection pressure - Pressure drop due to friction
- ISIP Gradient = ISIP / Formation Depth
- Closure Gradient = Closure Pressure / Formation Depth
- Net Fracture Pressure (Δpnet) – Net fracture pressure is the additional pressure within the frac above the pressure required to keep the fracture open. It is an indication of the energy available to propagate the fracture.
- Δpnet = ISIP - Closure Pressure
- Fluid
efficiency – Fluid efficiency is the ratio of
the stored volume within the fracture to the total fluid injected. A high
fluid efficiency means low leakoff and indicates the energy used to inject
the fluid was efficiently utilized in creating and growing the fracture.
Unfortunately, low leakoff is also an indication of low permeability.
For minifrac after-closure analysis, high fluid efficiency is coupled
with long closure durations and even longer identifiable flow regime trends

- Gc is the G-function time at fracture closure
- Formation leakoff characteristics and fluid loss coefficients.
G-Function Analysis
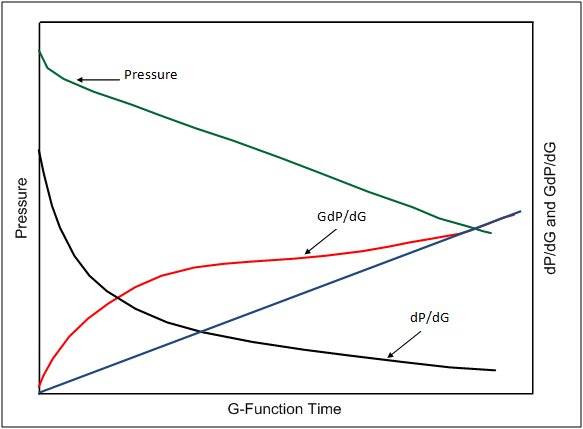
Post-injection (pre-closure) pressure falloff analysis can be performed using the G-function and root time methods. The G-function is a dimensionless time function designed to linearize the pressure behaviour during normal fluid leakoff from a bi-wing fracture. Any deviations from this behaviour can be used to characterize other leakoff mechanisms. The root time plot exhibits similar behavior and can be used to support the G-function analysis.
A straight-line trend of the G-function derivative (Gdp/dG) is expected where the slope of the derivative is still increasing. Position the Fracture Closure Identification line, which is anchored to the origin by default, through the straight-line portion of the G-Function derivative. Fracture closure is identified as the point where the G-Function derivative starts to deviate downward from the straight line as shown in the following figure.
| Note: | The shape of the G-function derivative prior to closure qualitatively describes how fluid moves from the fracture into the formation (see Fluid Leakoff Types). |
Algebraic Definition of the G-Function
The G-function is a dimensionless time function relating shut-in time (t) to total pumping time (tp) at an assumed constant rate.
The basic G-Function calculations are based on the following equations:


Two limiting cases for the G-function are shown here:
- The equation for α = 1.0 is for low leakoff, or high efficiency where the fracture area open after shut-in varies approximately linearly with time.
- The equation for α = 0.5 is for high leakoff, or low efficiency fluids where the fracture surface area varies with the square-root of time after shut-in.
- The value of g0 is the computed value of g at shut-in.
One of the key variables identified by Nolte is the difference between a high efficiency (upper limit) and a low efficiency (lower limit) leak-off condition. These two conditions have no significant effect on the overall shape of the curves.
Square Root Time Analysis
Fracture closure can be identified by the peak of the first derivative on the sqrt(t) plot, which corresponds to an inflection point on the pressure curve. The semi-log derivative behaves similar to the G-Function Analysis. A user-defined (Sqrt(t)) analysis line may be added to the sqrt(t) plot to help identify the point of inflection.
.png)
Fluid Leakoff Types
The G-Function plots for four common leakoff types, and the corresponding identification of fracture closure pressure are described in the following section:
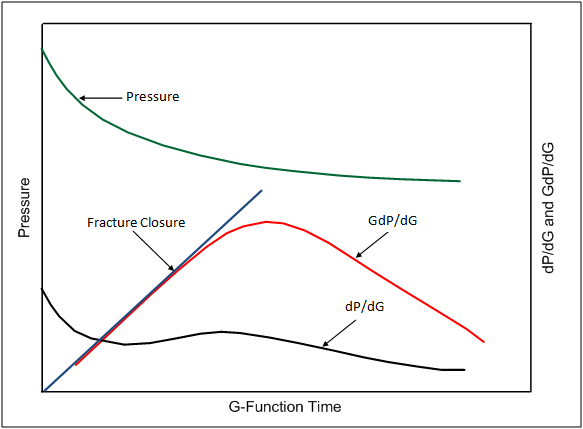
Normal Leakoff
Normal leakoff occurs when the fracture area is constant during shut-in and the leakoff occurs through a homogeneous rock matrix.
Two characteristics are visible on the G function curve:
- A constant pressure derivative (dP/dG) during fracture closure.
- The G-Function derivative (G dP/dG) lies on a straight line that passes through the origin.
The fracture closure point can be identified when the G-Function derivative (G dP/dG) starts to deviate downward from the straight line. The time and pressure corresponding to this point are identified from a marker set at this point.
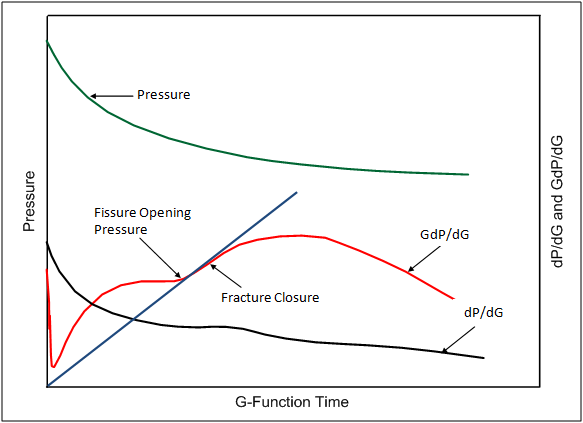
Pressure-Dependent Leakoff
Pressure-dependent leakoff (PDL) indicates the existence of secondary fractures intersecting the main fracture, and is identified by a characteristic “hump” in the G- Function derivative that lies above the straight line fit through the normal leakoff data. This hump indicates fluid is leaking off faster than expected for a normal bi-wing fracture. The interception of secondary fractures, which could be natural or induced, facilitates this additional leakoff by providing a larger surface area exposed to the matrix.
The characteristic signatures of PDL are:
- A characteristic large “hump” in the G-Function derivative; G dP/dG lies above the straight line that passes through the origin.
- Subsequent to the hump, the pressure decline exhibits normal leakoff.
- The portion of the normal leakoff lies on a straight line passing through the origin.
- The end of the hump is identified as “fissure opening pressure”.
As shown below, the fracture closure point is identified from the G-Function derivative G dP/dG when it starts to deviate downward from the straight line.
Transverse Storage / Fracture Height Recession
The G-Function derivative G dP/dG can also fall below a straight line that extrapolates through the normal leakoff data, exhibiting a concave up-trend. This indicates fluid is leaking off slower than expected for a normal bi-wing fracture and suggests that the fracture has some pressure support. Two scenarios can explain this trend as discussed below.
1. Transverse storage occurs when the main fracture intercepts a secondary fracture network, which could be natural or induced. This differs from PDL in that the dominant effect of the secondary fractures is to provide pressure support to the main fracture, rather than additional surface area for leakoff. There can be cases where transverse storage (pressure support) dominates, followed by a period of PDL before closure of the main fracture occurs.
2. Fracture height recession occurs if the fracture propagates through adjoining impermeable layers (above or below the pay zone) during injection. In the normal leakoff scenario, fluid can leak off from the entire surface area of the fracture. For fracture height recession, leakoff can only occur in the portion of the fracture which is in communication with the permeable zone. As a result, the leakoff rate is slower than the normal case. Eventually, the fracture area in the impermeable layer(s) starts closing (height recession), and during this period the rate of pressure decline increases. After the fracture height recedes to the edge of the permeable zone, the entire area of the frac contributes to leak off, and a period of normal leakoff ensues.
The three characteristic signatures for height recession during shut-in are:
- The G-Function derivative G dP/dG lies below a straight line extrapolated through the normal leakoff data.
- The G-Function derivative G dP/dG exhibits a concave up trend.
- The First Derivative dP/dG also exhibits a concave up trend.
![]()
Fracture Tip Extension
Fracture tip extension occurs when a fracture continues to grow even after injection is stopped and the well is shut-in. It is a phenomenon that occurs in very low permeability reservoirs, as the energy which normally would be released through leakoff is transferred to the ends of the fracture resulting in fracture tip extension.
The characteristic signatures for a fracture tip extension are:
- The G-Function derivative G dP/dG initially exhibits a large positive slope that continues to decrease with shut-in time, yielding a concave-down curvature.
- Any straight line fit through the G-Function derivative G dP/dG intersects the y - axis above the origin.
Until the main fracture closes, the G-Function derivative behaves similarly to PDL, and it is difficult to distinguish between PDL and fracture tip extension. The following plot shows a typical response for fracture tip extension after shut-in.
Instantaneous Shut-In Pressure
Instantaneous shut-in pressure (ISIP) is defined as:
- ISIP = Final injection pressure - Pressure drop due to friction in the wellbore and perforations or slotted liner
ISIP can be a difficult value to quantify and, as a result, there are numerous ways to obtain an estimate of ISIP in WellTest.
- If sandface pressures have been calculated, a default value for ISIP is calculated by subtracting the friction component of the sandface calculation from the final injection pressure. This tends to overestimate the value of ISIP because it doesn't account for friction through the perforations or near the wellbore.
- It is also common practice to estimate ISIP by placing a straight line on the early falloff portion of the history plot. After shut-in, the friction decreases rapidly and this can appear to cause a step drop in pressure, or a brief linear trend in the data (prior to the expected concave-up-trend of the falloff).
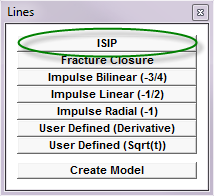
To do this, add an ISIP line to the ISIP plot.
By default it is positioned between the final injection pressure and the first falloff pressure. An ISIP arrow may be added by selecting the ISIP button on the toolbar above the ISIP plot and clicking on the appropriate point on the plot. It is also possible to estimate ISIP in a similar fashion using the G-Function and Sqrt Time plots (ISIP arrows are not currently available on these plots but the standard annotation arrow can be used).
![]()
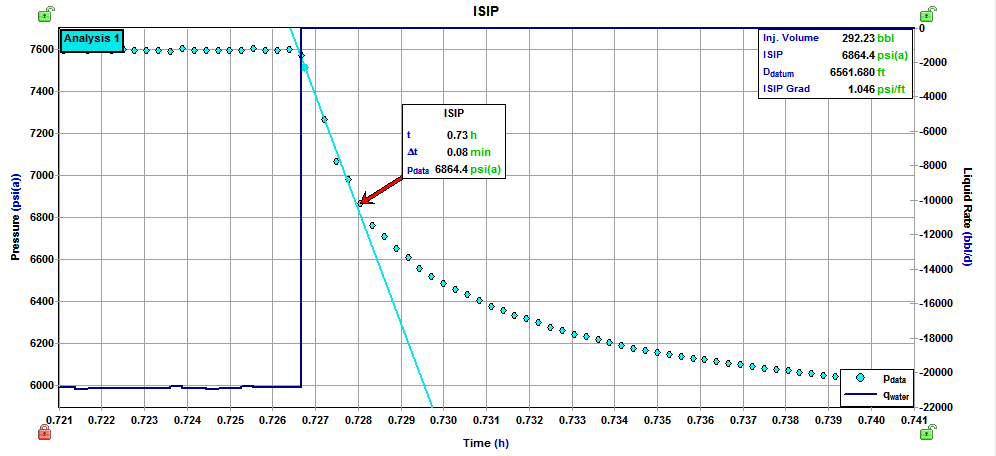
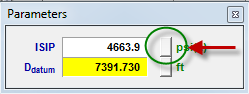
After an ISIP arrow has been added to the plot, the pressure value from the arrow will be added to the list of ISIP defaults.
| Note: | The ISIP defaults may be accessed via the button beside the ISIP field in the Parameters dialog box. |
If a closure arrow is placed on the G-function plot, ISIP can be calculated from the following equation, which assumes normal leakoff.

Fracture Closure Pressure
Fracture closure pressure is the fluid pressure needed to initiate the opening of a fracture. This is not the same as the breakdown pressure, which is the fluid pressure required to initiate a fracture in intact rock.
Closure pressure is equal to the minimum in-situ stress because the pressure required to open a fracture is the same as the pressure required to counteract the stress in the rock perpendicular to the fracture. Closure pressure is determined from the G-Function or the Sqrt(t) plot.