Creating an FMB Analysis
To create a flowing material balance (FMB) analysis:
1. Launch an entity for analysis.
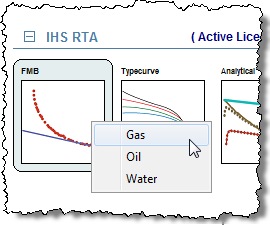
2. Click the FMB thumbnail.
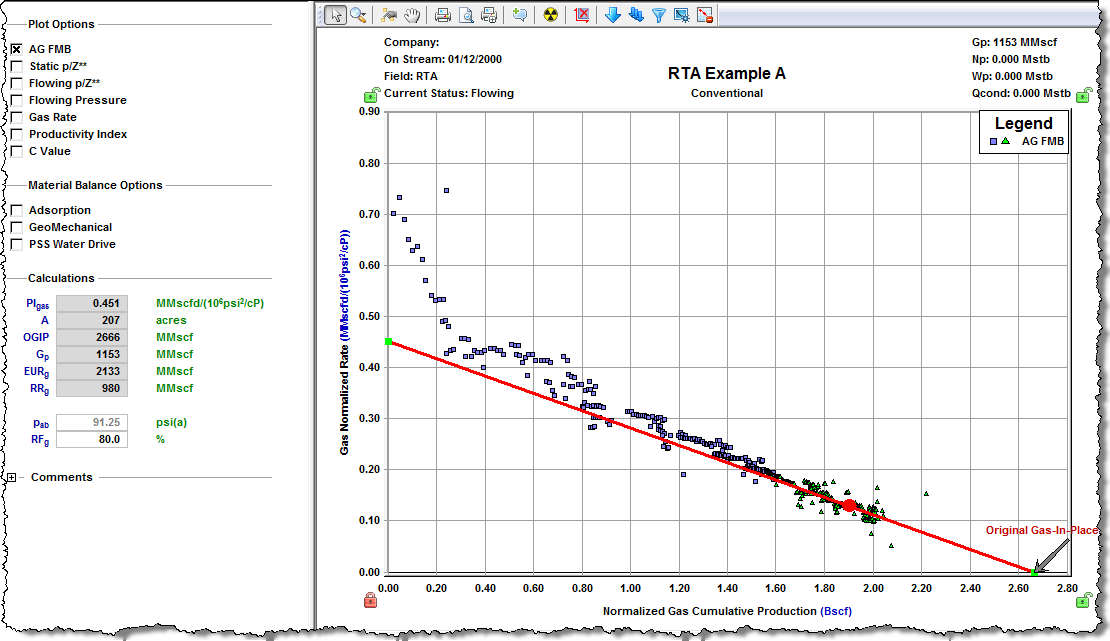
The worksheet is created, and displays an Agarwal-Gardner Flowing Material Balance (AG FMB) by default. See Agarwal-Gardner Normalized Rate for additional information.
3. Best fit the analysis to the data by doing one of the following:
- selecting data points
- manipulating the curve graphically
4. Select desired plot options:
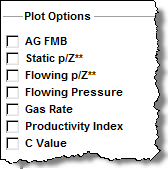
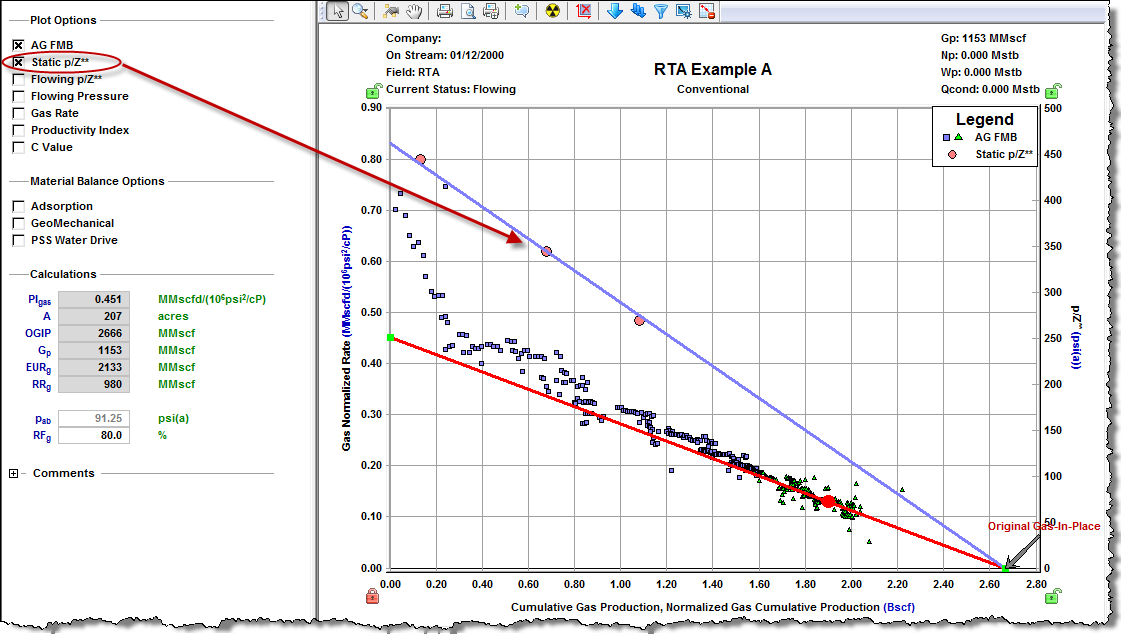
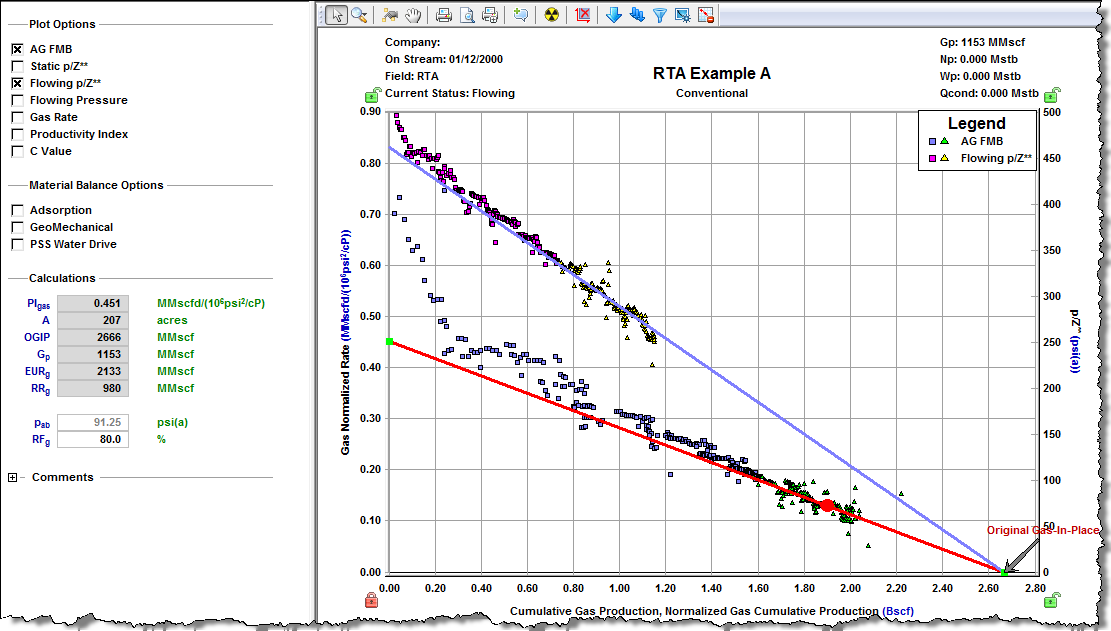
- AG FMB: Agarwal-Gardner FMB plots normalized rate versus normalized pressure, and can be used for both oil and gas systems.
- Static p/z (gas) / Static Pressure Data (Oil): If static pressures are available, a static p/z** plot can help confirm the OGIP / OOIP.
- Flowing p/z**: This plot is only available for gas systems and is analogous to the static p/z** plot used in gas wells. However, it uses flowing pressures rather than static buildup pressures. The calculated OGIP will be the same as that calculated from the AG FMB.
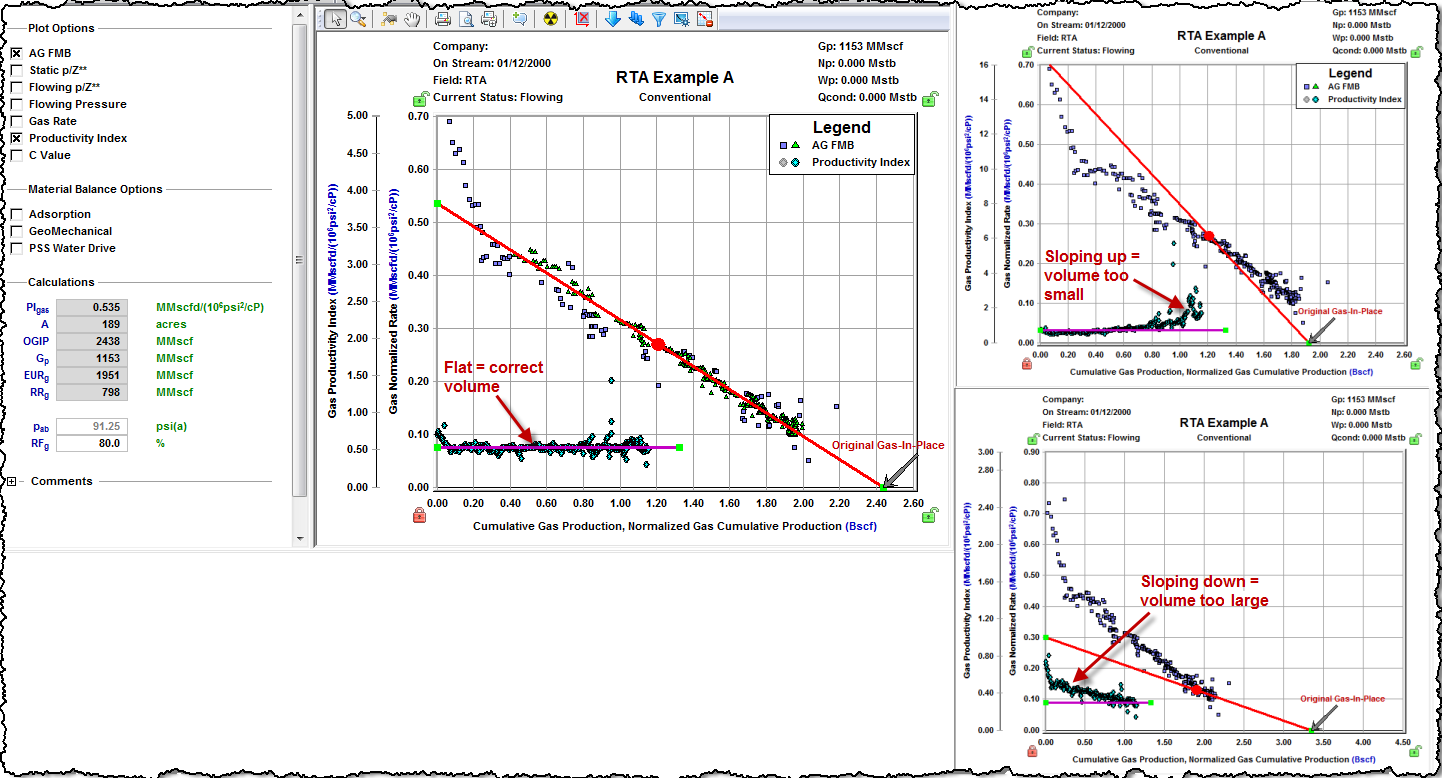
- Productivity Index: The productivity index is only available for gas systems. If the correct OGIP is calculated from the material balance analysis, the productivity index should plot as a flat line. A downward sloping line can be an indication that the calculated volume is too large, while an upward sloping line can indicate that the calculated volume is too small. Productivity indices that fall off a flat line can also be an indication of operational issues with the well.