Interpretation of Buildup Data in Multi-Fractured Hz Wells
Buildup data from multi-fractured horizontal wells (MFHW) in unconventional reservoirs often display a derivative signature which looks like radial flow and is frequently misinterpreted as such without due consideration of the expected flow regimes from these systems. Due to the large number of hydraulically induced fractures and the geometry of a typical MFHW completion, radial flow is unlikely to develop. This is confirmed through analysis of production data, which shows no evidence of radial flow, but instead, reveals that linear flow regimes dominate for the majority of a well’s lifetime. This is consistent with the expected flow behavior, and leads to confusion on how to interpret buildup data that often appear like radial flow.
Analytical and numerical models, with varied MFHW completion details and reservoir properties, have been used to investigate which of the possible flow regimes can be practically identified in buildup data (Lougheed, 2013). The following list pertains to both oil and gas reservoirs.
| Flow Regime | Likelihood of Observing |
|---|---|
| Wellbore storage | Likely |
| Vertical radial flow within fractures | Unlikely |
| Linear flow within fractures | Unlikely |
| Bilinear flow | Possible |
| Early linear flow | Likely |
| Early radial flow (around each fracture, prior to interference between fractures) | Unlikely |
| Late (Compound) linear flow | Possible |
| Late radial flow (around MFHW and fracture network) | Unlikely |
| Boundary-dominated flow (PSS flow) | Unlikely |
As shown below, the buildup derivative shows more character than the drawdown derivative (Lougheed, 2013). This is caused by superposition. Flow time influences the buildup derivative behavior (Streltsova, 1984).
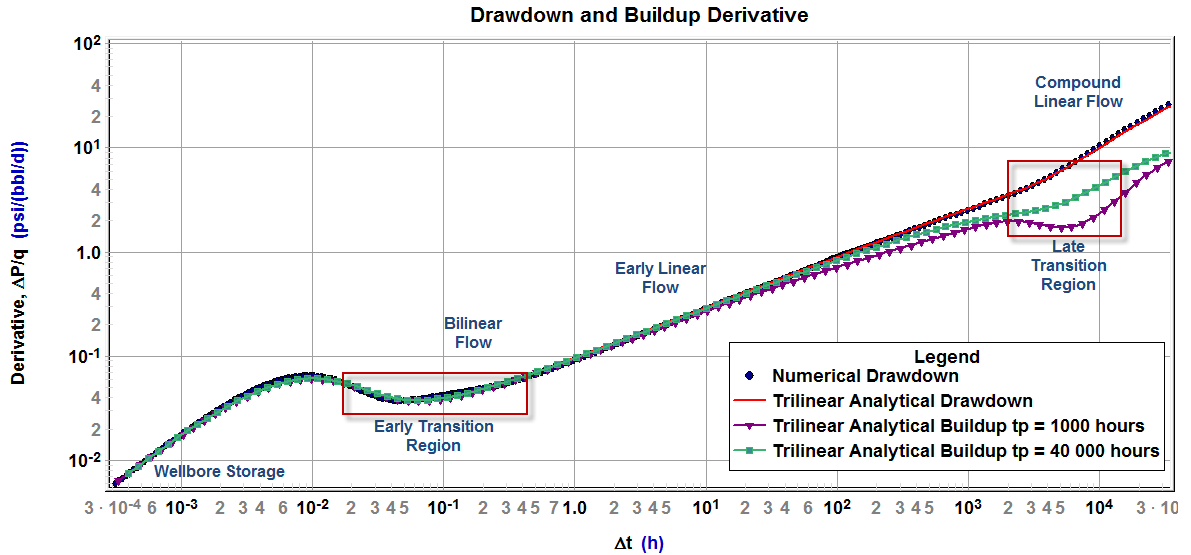
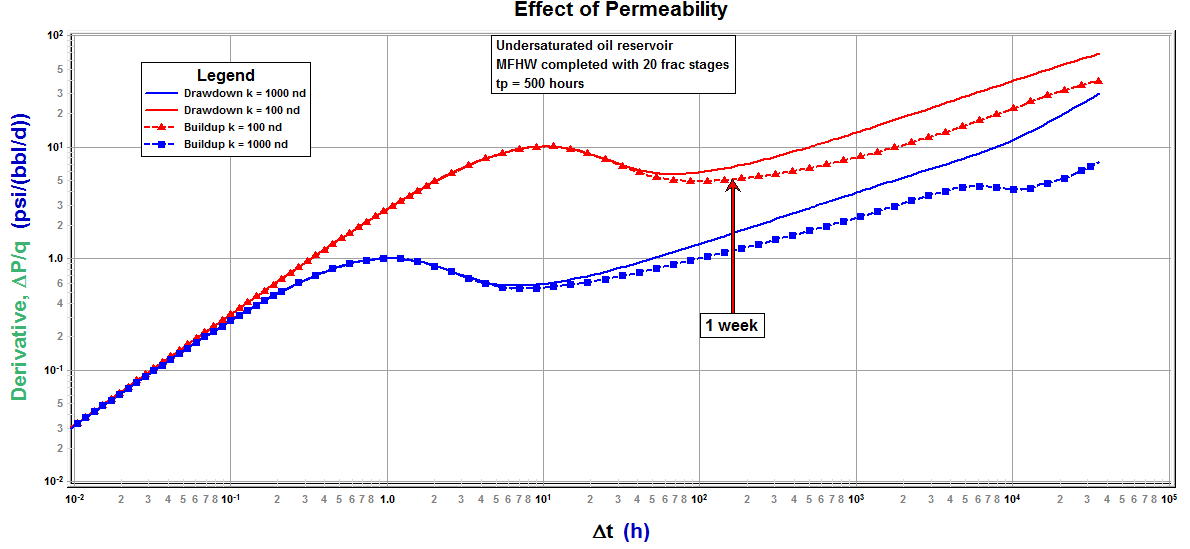
Analysts are cautioned against misinterpreting the transition regions as radial flow. In the above plot, the buildup derivative flattens during the late transition region. Although test schedule, completion geometry, and reservoir and fluid properties can affect the transition regions, permeability has the biggest impact on when the transition occurs and how long it lasts. The following plot illustrates that the early transition region can also exhibit trends that look like radial flow in low permeability reservoirs (Lougheed, 2013). Linear flow has not developed after one week of shut-in from the 100 "nd" reservoir (the curve with red triangles).
Early Transition Observations:
- The early transition may dominate the buildup derivative for lower permeability reservoirs. The early transition region lasts approximately one log cycle, but its duration and the time in commences depends mostly on permeability.
- The early transition does not occur for high FCD values.
- Larger storage values and shorter flow times prolong this transition region.
- Shorter flow times and larger fracture half lengths make the transition appear flatter.
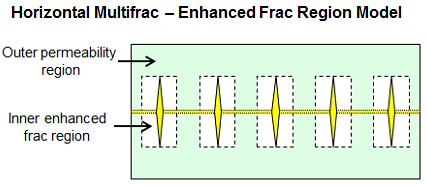
As learned from well test interpretation of conventional wells, the presence of heterogeneity can greatly impact the signature of the buildup derivative. Many MFHWs drilled in unconventional reservoirs, such as the Eagle Ford, behave as if there is a region around the fractures with an enhanced permeability. The enhanced permeability region simulates a complex fracture network (branch fractures). The Enhanced Frac Region model (Stalgorova and Mattar (2012)) was used to investigate buildup trends in the presence of an enhanced permeability region (Lougheed, 2013).
In their study, Dylan Lougheed and Marty Santo found that either an enhanced or a reduced permeability around the fractures could result in misleading derivative signatures. A reduction in permeability around the fracture is possible if a buildup test is conducted before the well has cleaned up; because of relative permeability effects in the fluid invaded zone. The following figures are intended to illustrate examples of buildup derivative signatures that can occur in the presence of heterogeneity in MFHWs.
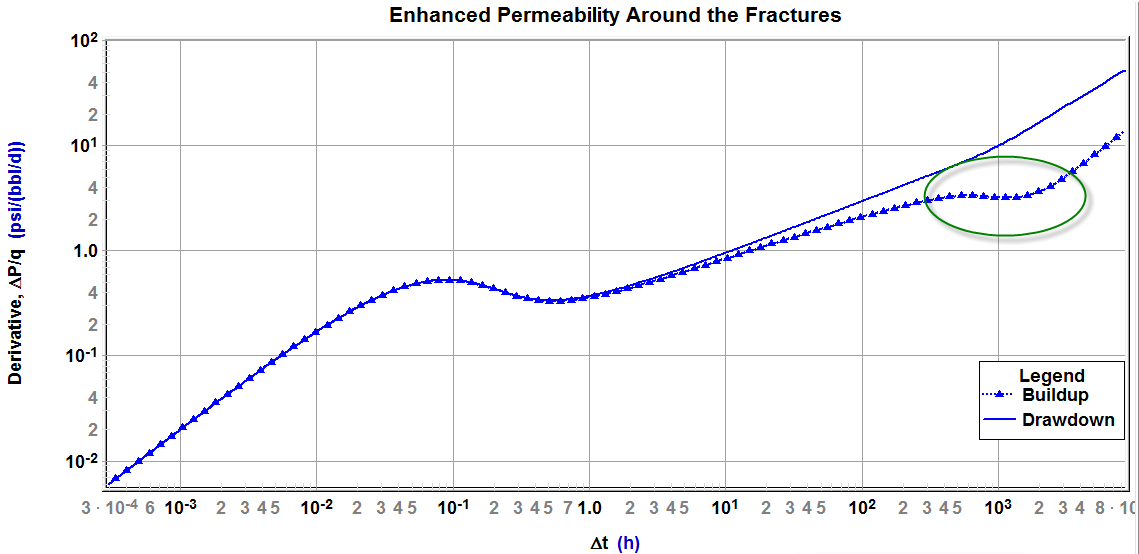
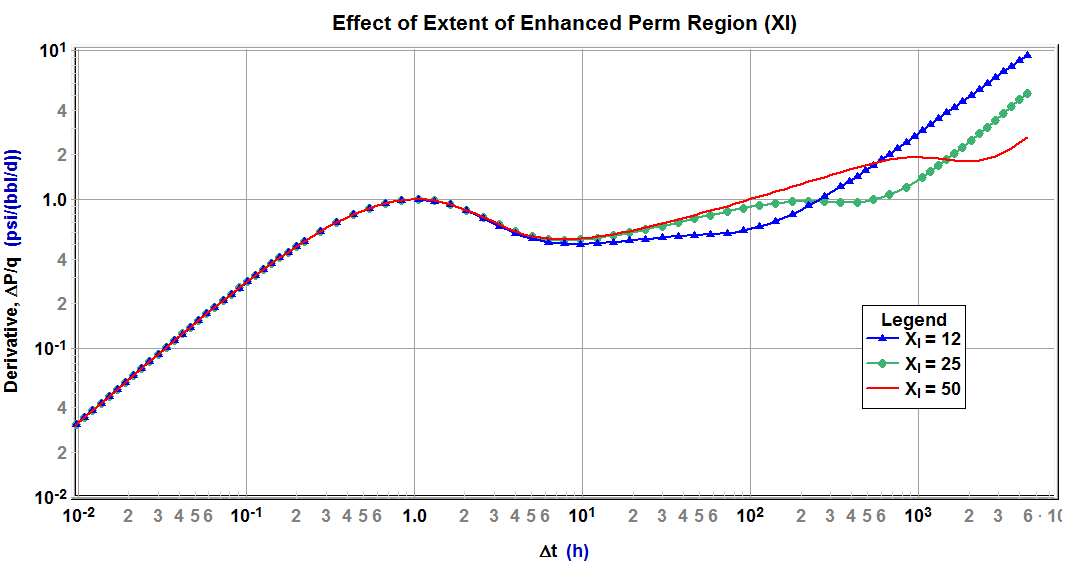
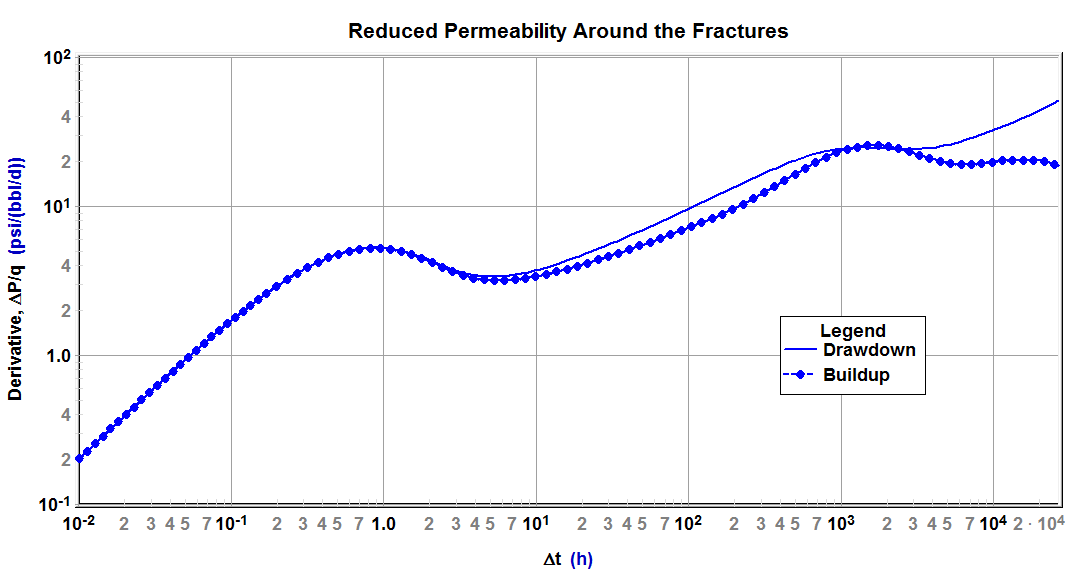
For more details on these plots, refer to Lougheed's paper (Lougheed, 2013).