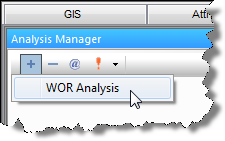
Creating a WOR Analysis
Water-oil ratio (WOR) forecasting is a method of trending future water
production for the purpose of forecasting oil production and determining
EUR![]() . The default worksheets for WOR analysis are:
. The default worksheets for WOR analysis are:
- WOR vs Cumulative Oil
- WOR+1 vs Cumulative Oil
- Water Cut vs Cumulative Oil
A WOR analysis can be created on any worksheet that has cumulative oil for the x-axis, and WOR, WOR+1, or Water Cut on the y-axis. (Other y-axis selections can be present on the worksheet.)
Note: Default options for WOR analyses are found under Water Oil Ratio in the Analysis Settings section of the Options dialog box.
1. Launch an entity for analysis.
2. Click the Ratio Analysis thumbnail; then select the type of worksheet you want to create.

3. Add the WOR analysis to the worksheet. See Adding an Analysis for details.
When the analysis is created, it is "best fit" to the portion of data points set in the options menu (the default is the last 50% of the data points). A WOR analysis ends at the specified water cut or WOR cut-off. The result of the analysis is an estimate of EUR.

4. Best fit the analysis to the data by doing one of the following: