Creating a Type Well Analysis
To create a type well analysis:
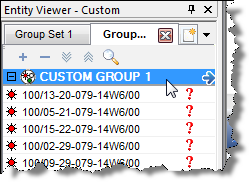
1. Launch a group for analysis.
2. Click the Type Well thumbnail; then select the type of worksheet you want to create.

3. Click the Data Sets tab; then select the axes and other variables that you want displayed on the plot.

4. Click the Wells tab; then remove outlier wells and set the well peak rates to time zero. See Setting Start Date Offsets to Peak Rate for details.

5. Add the Decline analysis in the Analysis Manager. See Adding an Analysis for details.

The analysis is initially "best fit" to the average of all the wells.
6. Best fit the analysis to the data by doing one of the following:

You can display the Results line, and add segments, as necessary.
The decline forecast is set to start at the project's reference
date. You can change this date in the Analysis Parameters pane, if you copy
the decline forecast to the individual wells that make up the group. See Copying and Pasting Analyses for details.
Or,
you can also change the reference date inside the individual well worksheets. See Adding a Reference Date for details.